
一、前言&环境准备
1.前言
当服务器具备IPMI接口时,BMC/IPMI web后台可以看到硬件的运行情况,比如CPU温度、内存温度、风扇转速、主板电压等,这些数据默认只能通过登录web后台或者ipmitool等接口工具来实时查看,看不到历史曲线图,也做不到监控告警,当服务器出现问题时,除了日志之外,这些物理传感器指标绘制的趋势图更有利于我们判断服务器在历史异常时间点的硬件状态趋势变化情况,或者实时监测指标到达设定的阈值时自动告警,因此本文油然而生。
2.环境准备
prometheus和grafana,前者作为数据采集,后者作为监控展示及告警,缺一不可,这两个组件如何安装非本文重点,本文建立在这两个环境之下。同时,prometheus、grafana和ipmi_exporter可以安装在同一主机,也可以独立安装在不同主机,本文采用的是后者,IP分配如下:
| 服务 | 主机IP |
|---|---|
| prometheus | 192.168.1.12 |
| grafana | 192.168.1.13 |
| ipmi_exporter | 192.168.1.199 |
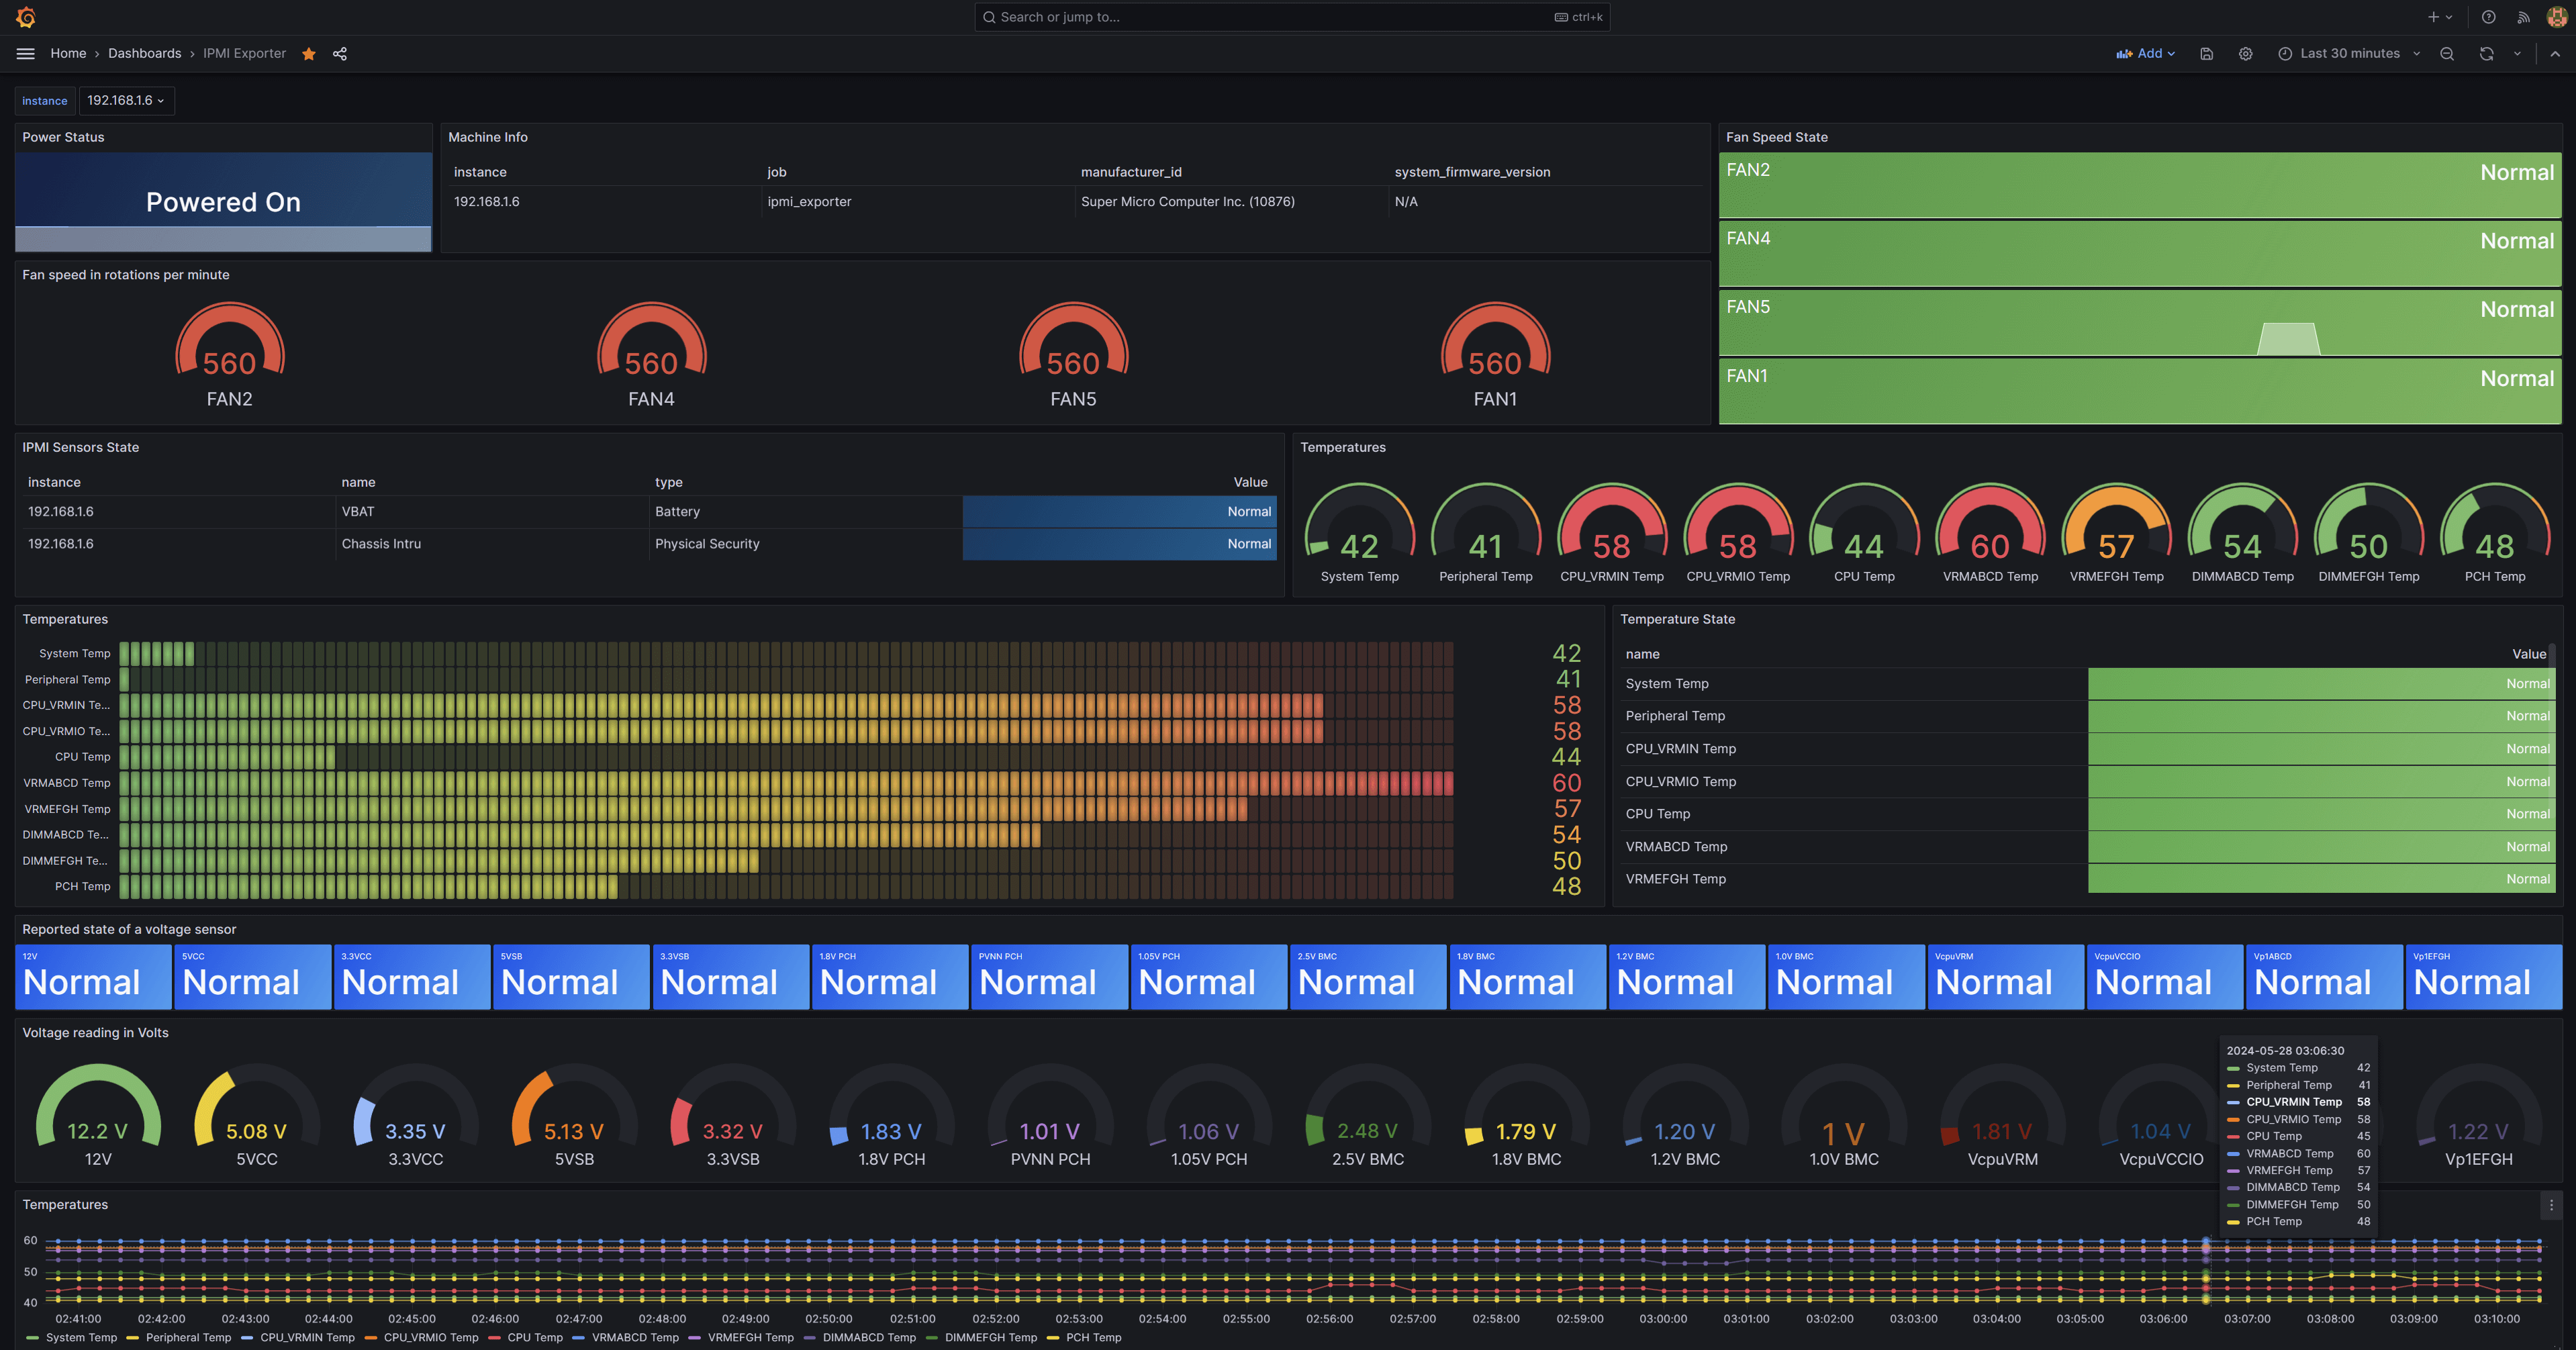
完成后效果图如下:
二、安装ipmi_exporter
安装方式任选其一即可,推荐使用二进制安装。
1.二进制安装
到此页面下载对应系统版本的二进制文件,解压即可。
示例:
$ wget https://github.com/prometheus-community/ipmi_exporter/releases/download/v1.8.0/ipmi_exporter-1.8.0.linux-amd64.tar.gz
$ tar xf ipmi_exporter-1.8.0.linux-amd64.tar.gz
不添加PATH环境变量的情况下,设置一个软链接到PATH路径下:
$ mv /opt/ipmi_exporter-1.8.0.linux-amd64 /opt/ipmi_exporter
$ ln -sf /opt/ipmi_exporter/ipmi_exporter /usr/local/bin/ipmi_exporter
验证是否可以成功执行:
$ ipmi_exporter -h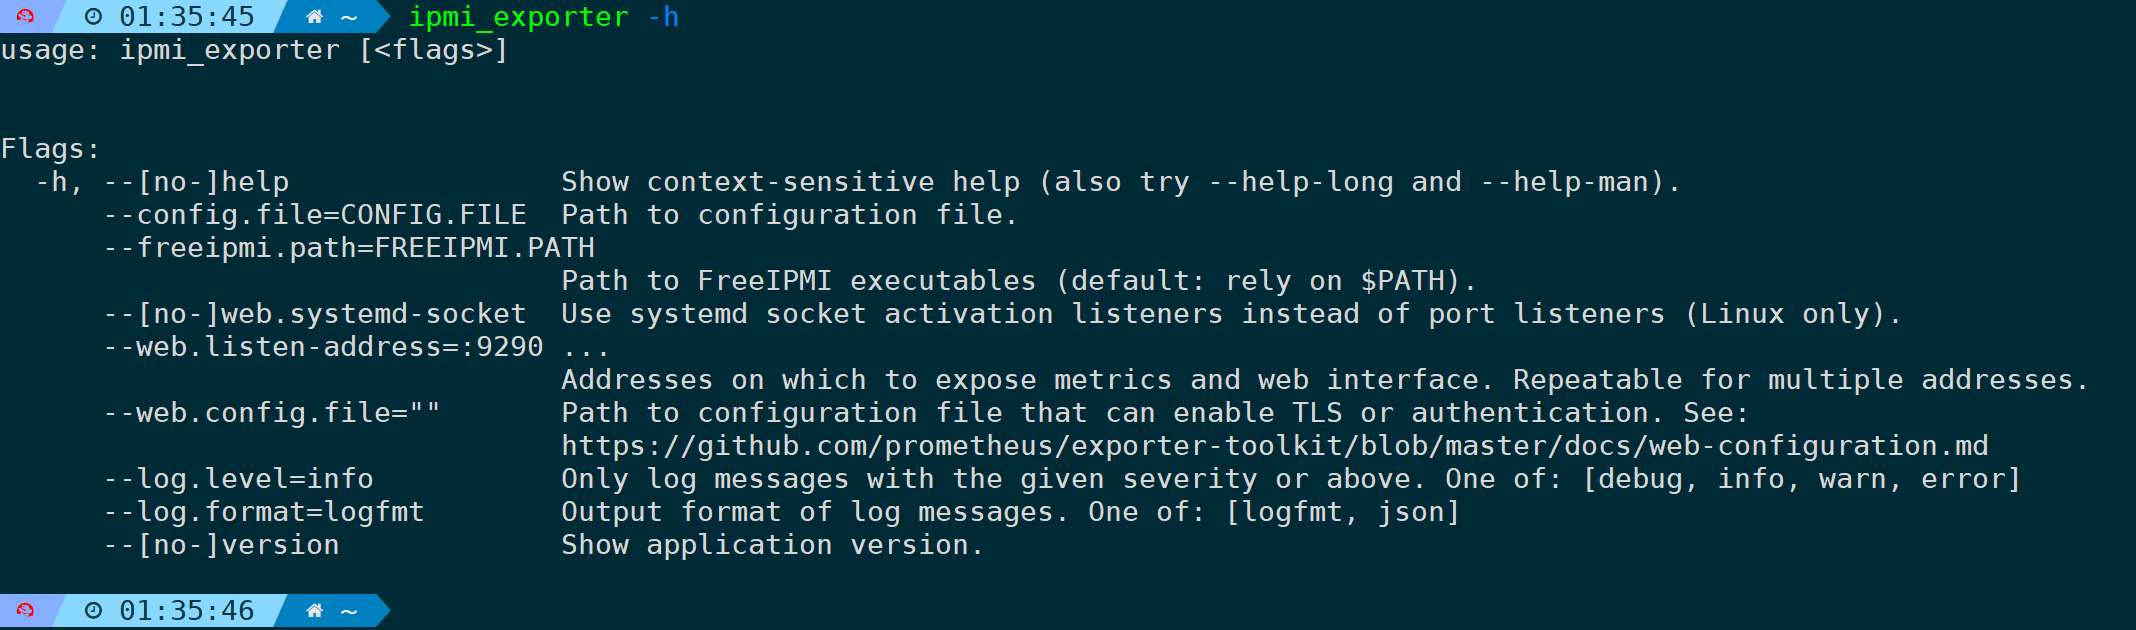
到此安装完毕。
2.源码安装
前提需要先安装golang环境。
mkdir /opt/git
cd /opt/git
git clone https://github.com/prometheus-community/ipmi_exporter.git
cd ipmi_exporter
make
make成功后,会在编译目录下生成二进制文件。
或者,直接执行got get,二进制文件会安装在$GOPATH/bin目录下:
go get github.com/prometheus-community/ipmi_exporter二选一即可,没有特殊需求统一建议二进制方式安装。
三、写systemD服务并安装FreeIPMI
1.写ipmi_exporter yaml配置文件:
$ mkdir /opt/ipmi_exporter
$ vim /opt/ipmi_exporter/ipmi_remote.yml
modules:
        default:
                # These settings are used if no module is specified, the
                # specified module doesn't exist, or of course if
                # module=default is specified.
                user: "ADMIN"     # 无特殊需求,填写这两行账号密码即可,IPMI用户名
                pass: "PASSWORD"  # 无特殊需求,填写这两行账号密码即可,IPMI密码
                # The below settings correspond to driver-type, privilege-level, and
                # session-timeout respectively, see `man 5 freeipmi.conf` (and e.g.
                # `man 8 ipmi-sensors` for a list of driver types).
                driver: "LAN_2_0"
                privilege: "user"
                # The session timeout is in milliseconds. Note that a scrape can take up
                # to (session-timeout * #-of-collectors) milliseconds, so set the scrape
                # timeout in Prometheus accordingly.
                # Must be larger than the retransmission timeout, which defaults to 1000.
                timeout: 10000
                # Available collectors are bmc, bmc-watchdog, ipmi, chassis, dcmi, sel,
                # and sm-lan-mode
                # If _not_ specified, bmc, ipmi, chassis, and dcmi are used
                collectors:
                - bmc
                - ipmi
                - chassis
                # Got any sensors you don't care about? Add them here.
                exclude_sensor_ids:
                - 2
                - 29
                - 32
                - 50
                - 52
                - 55
        dcmi:
                # Use these settings when scraped with module=dcmi.
                user: "admin_user"
                pass: "another_pw"
                privilege: "admin"
                driver: "LAN_2_0"
                collectors:
                - dcmi
        thatspecialhost:
                # Use these settings when scraped with module=thatspecialhost.
                user: "some_user"
                pass: "secret_pw"
                privilege: "admin"
                driver: "LAN"
                collectors:
                - ipmi
                - sel
                # Need any special workaround flags set? Add them here.
                # Workaround flags might be needed to address issues with specific vendor implementations
                # e.g. https://www.gnu.org/software/freeipmi/freeipmi-faq.html#Why-is-the-output-from-FreeIPMI-different-than-another-software_003f
                # For a full list of flags, refer to:
                # https://www.gnu.org/software/freeipmi/manpages/man8/ipmi-sensors.8.html#lbAL
                workaround_flags:
                - discretereading
                # If you require additional command line arguments (e.g. --bridge-sensors for ipmimonitoring),
                # you can specify them per collector - BE CAREFUL, you can easily break the exporter with this!
                custom_args:
                        ipmi:
                        - "--bridge-sensors"
        advanced:
                # Use these settings when scraped with module=advanced.
                user: "some_user"
                pass: "secret_pw"
                privilege: "admin"
                driver: "LAN"
                collectors:
                - ipmi
                - sel
                # USING ANY OF THE BELOW VOIDS YOUR WARRANTY! YOU MAY GET BITTEN BY SHARKS!
                # You can override the command to be executed for a collector. Paired with
                # custom_args, this can be used to e.g. execute the IPMI tools with sudo:
                collector_cmd:
                        ipmi: sudo
                        sel: sudo
                custom_args:
                        ipmi:
                        - "ipmimonitoring"
                        sel:
                        - "ipmi-sel"
2.写systemD服务
创建个prometheus用户,禁用登录权限:
$ useradd prometheus -M -s /sbin/nologin添加service配置文件:
$ vim /etc/systemd/system/ipmi_exporter.service
[Unit]
Description=IPMI Exporter
Wants=network-online.target
After=network-online.target
[Service]
User=prometheus
Type=simple
ExecStart=/usr/local/bin/ipmi_exporter --config.file=/opt/ipmi_exporter/ipmi_remote.yml
[Install]
WantedBy=multi-user.target
$
重载并启动服务:
$ systemctl daemon-reload
$ systemctl enable ipmi_exporter --now
验证服务已运行成功,并且没有报错:
$ journalctl -u ipmi_exporter.service -f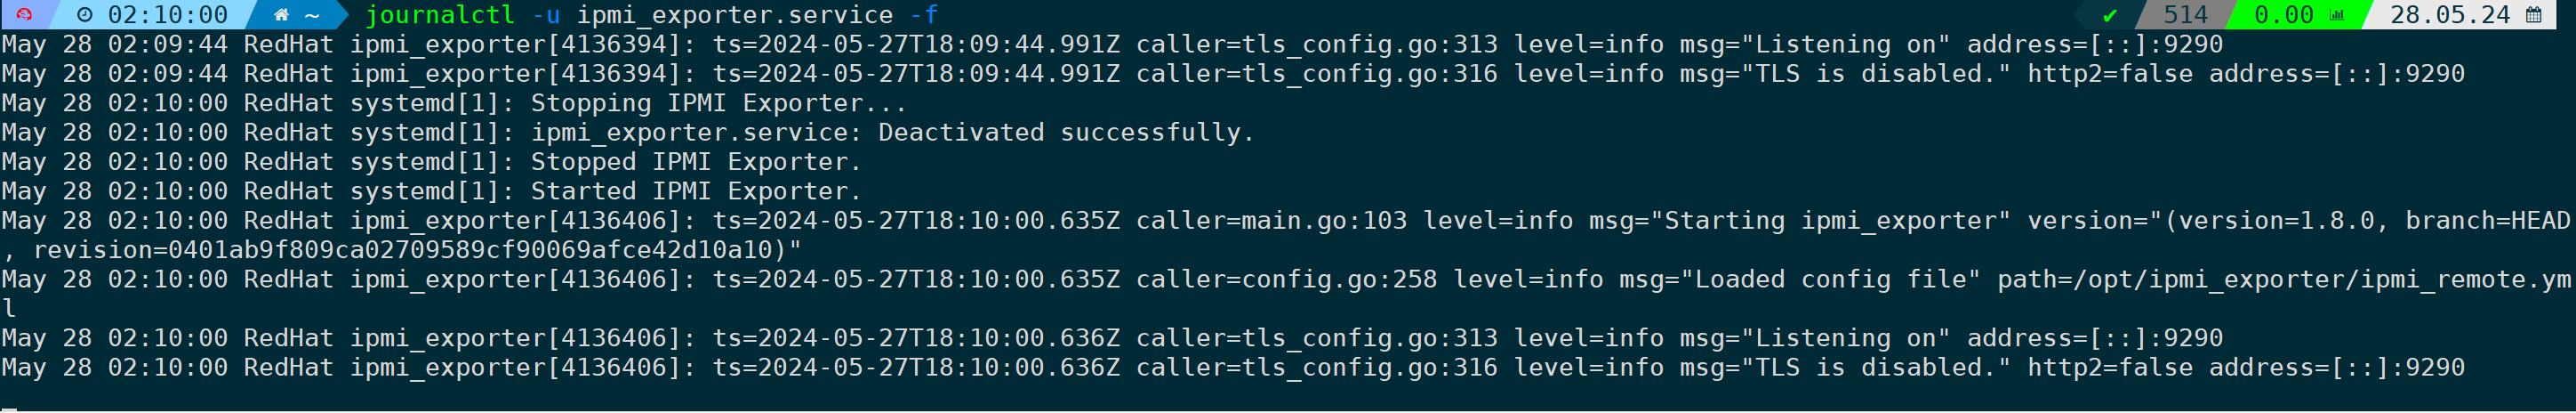
默认监听9290端口,如有端口占用需修改为其它端口,修改下systemd服务加上监听参数即可:
ExecStart=/usr/local/bin/ipmi_exporter --web.listen-address=:端口号 --config.file=/opt/ipmi_exporter/ipmi_remote.yml3.安装FreeIPMI
ipmi_exporter所在主机需要安装以下IPMI套件,ipmi_exporter依赖这些组件,来收集metric硬件传感信息:
ipmimonitoring/ipmi-sensorsipmi-dcmiipmi-rawbmc-infoipmi-selipmi-chassis
这些组件,都包含在FreeIPMI套件里,因此只需安装FreeIPMI即可。
| 发行版 | 安装命令 |
|---|---|
| Archlinux | pacman -Sy extra/freeipmi |
| Centos/Redhat | yum install freeipmi -y |
| Debian/Ubuntu | apt install freeipmi -y |
| Gentoo | emerge –ask freeipmi |
安装后,通过tab补全,可以看到这些依赖组件都是独立的命令:

ipmi_exporter服务采集数据时会用到它们。
四、配置Prometheus并验证metrics
1.配置ipmi_targets
写一个targets文件,填写需要监控的ipmi主机:
$ vim /usr/local/prometheus/ipmi_targets.yml
- targets:
  - xx.xx.xx.xx # 被监控的IPMI主机IP
  labels:
    job: ipmi_exporter
2.配置prometheus
在prometheus主配置文件里追加以下ipmi_exporter的任务,prometheus将收集来自ipmi_exporter服务主机的metrics数据:
$ vim /usr/local/prometheus/prometheus.yml
- job_name: ipmi_exporter
    params:
      module: ['default']
    scrape_interval: 1m
    scrape_timeout: 30s
    metrics_path: /ipmi
    scheme: http
    file_sd_configs:
    - files:
      - /usr/local/prometheus/ipmi_targets.yml
      refresh_interval: 5m
    relabel_configs:
    - source_labels: [__address__]
      separator: ;
      regex: (.*)
      target_label: __param_target
      replacement: ${1}
      action: replace
    - source_labels: [__param_target]
      separator: ;
      regex: (.*)
      target_label: instance
      replacement: ${1}
      action: replace
    - separator: ;
      regex: .*
      target_label: __address__
      replacement: 192.168.1.199:9290 # 这里写ipmi_exporter服务所在的主机,如果运行在同一机器,则写本机即可
      action: replace
之后重启prometheus服务:
systemctl restart prometheus追踪下日志是否正常运行:
journalctl -u prometheus.service -f
3.验证metrics数据收集情况
此时到Prometheus的web页面,找到我们添加的ipmi_exporter任务,确保已经UP:

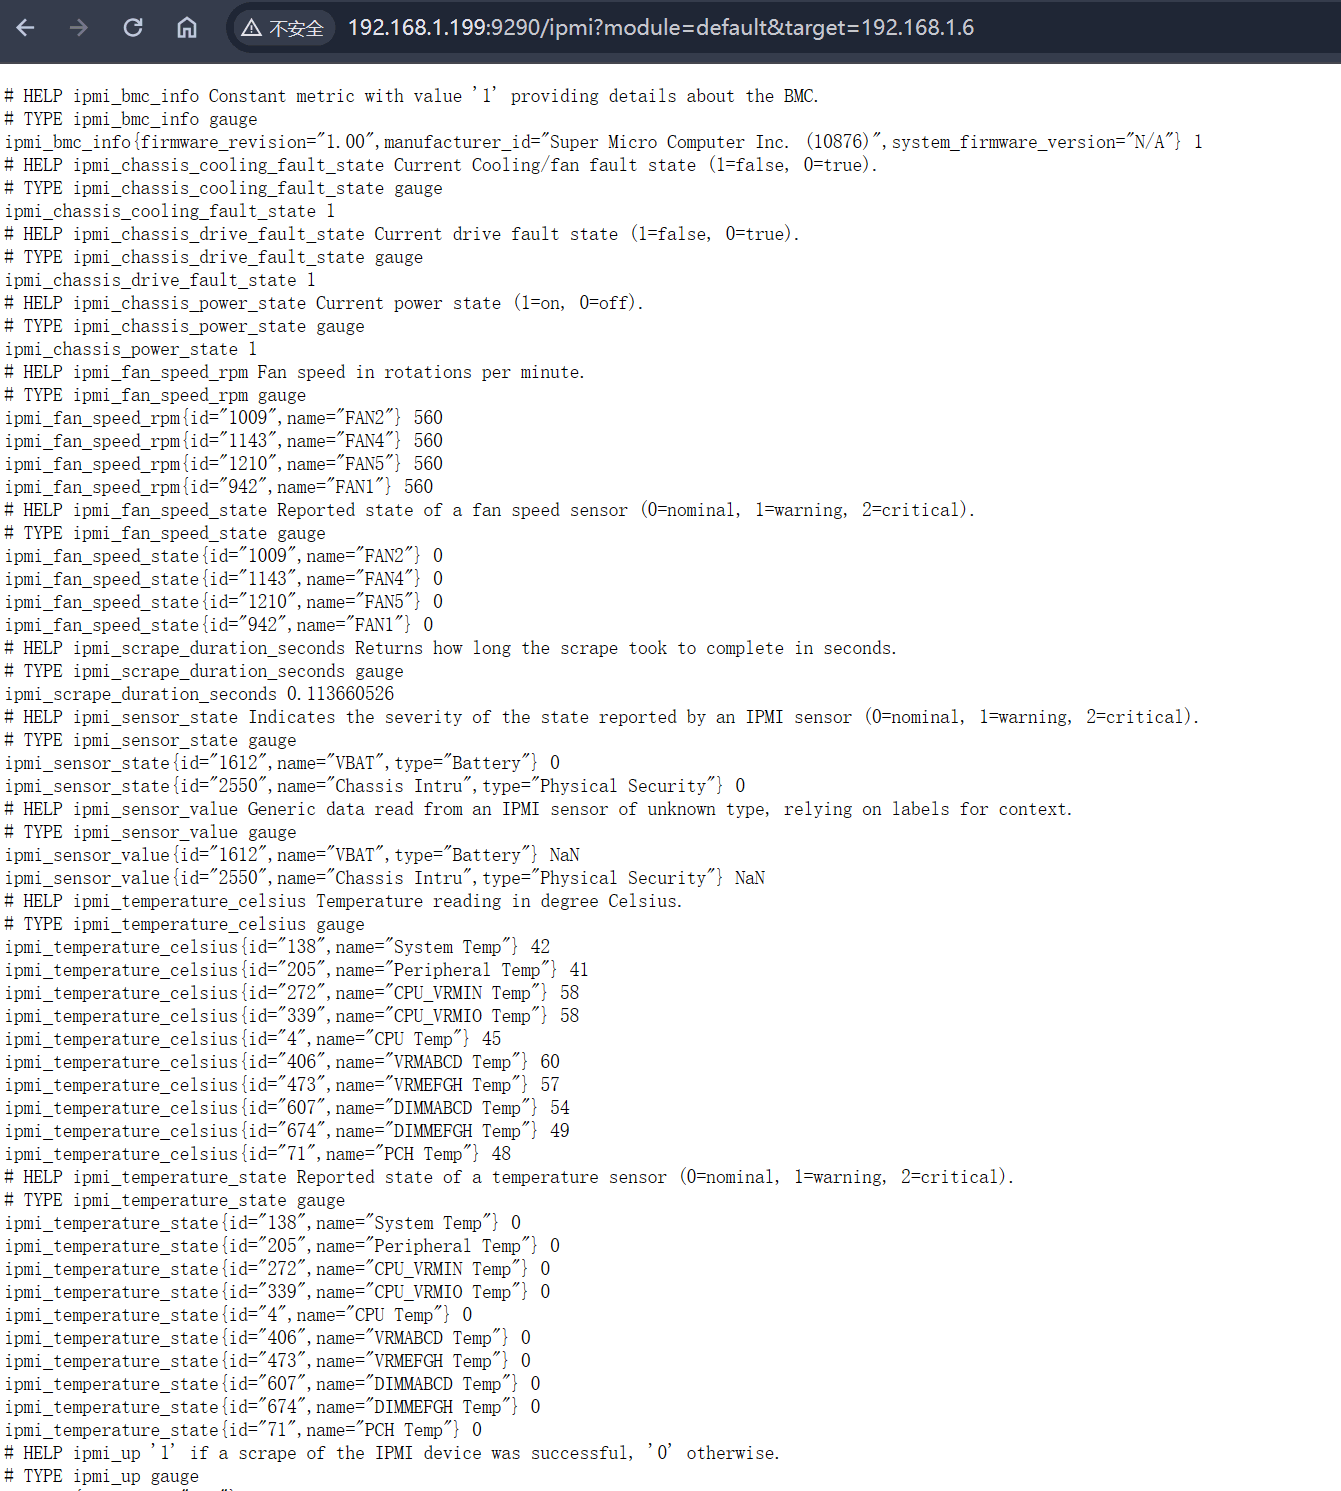
Endpoint链接点进去可以看到ipmi_exporter收集的metrics原始数据:
五、配置grafana监控面板和邮件告警
1.导入监控模板
获取到metric数据后,最后一步则将这些数据通过监控图的方式展示出来,这里采用模板方式进行导入。
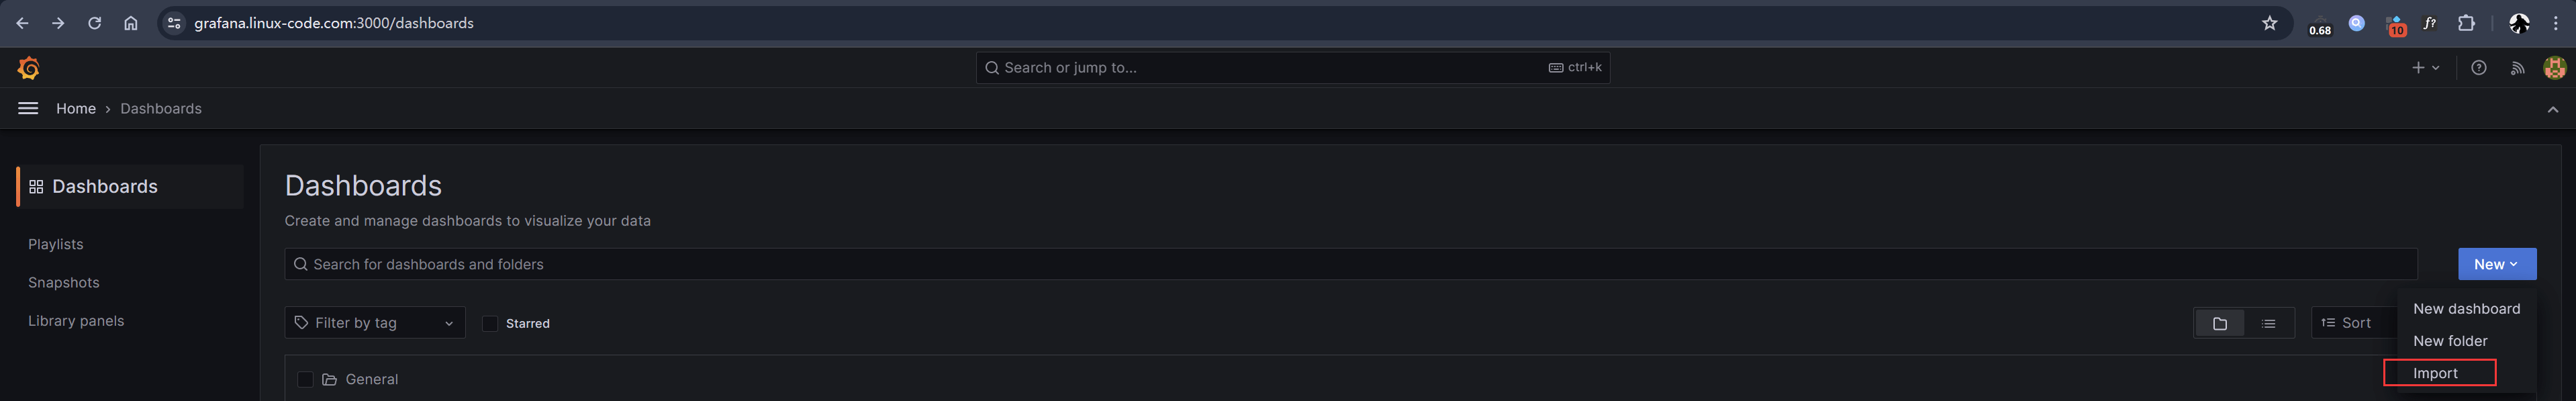
在Grafana主面板中,点击导入选项:
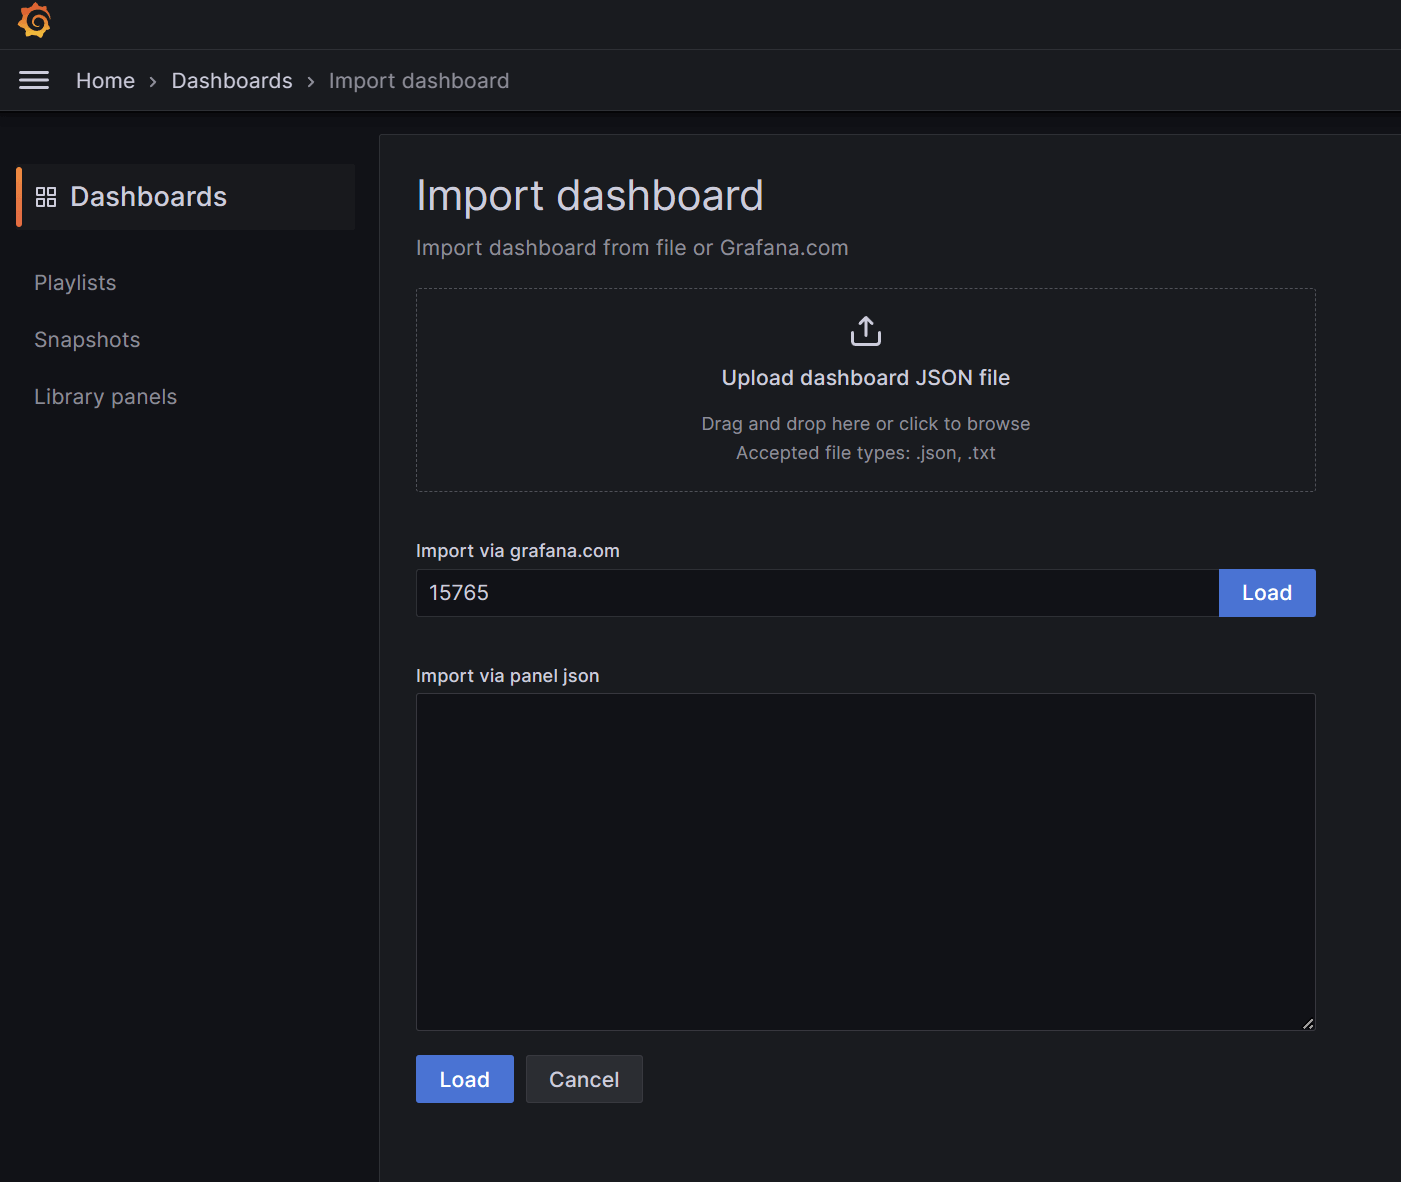
填写ID为15765,之后点击Load:
在此模板ID基础上稍做修改后(按需修改),效果如下:

2.配置邮件告警
1)修改grafana.ini配置文件
修改grafana的配置文件,以/etc/grafana.ini为例,找到smtp模块并增加以下内容:
$ vim /etc/grafana.ini
[smtp]
enabled = true
host = stmp.exmail.qq.com:465  # smtp发送服务器,这里以腾讯企业邮为例
user = user@xxx.com            # 邮箱用户账号
password = password            # 邮箱密码或授权码
from_address = user@xxx.com    # 和用户名保持一致即可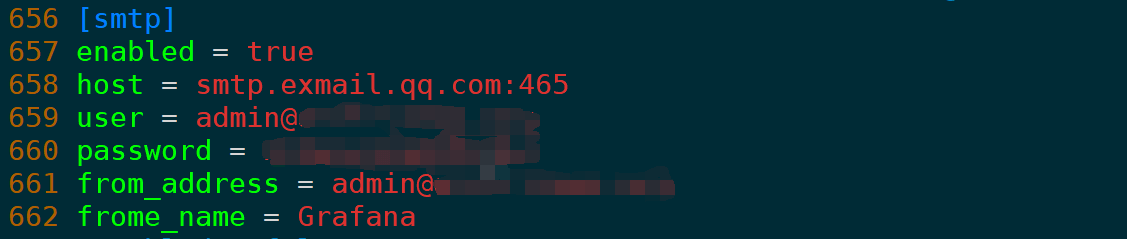
之后重启Grafana:
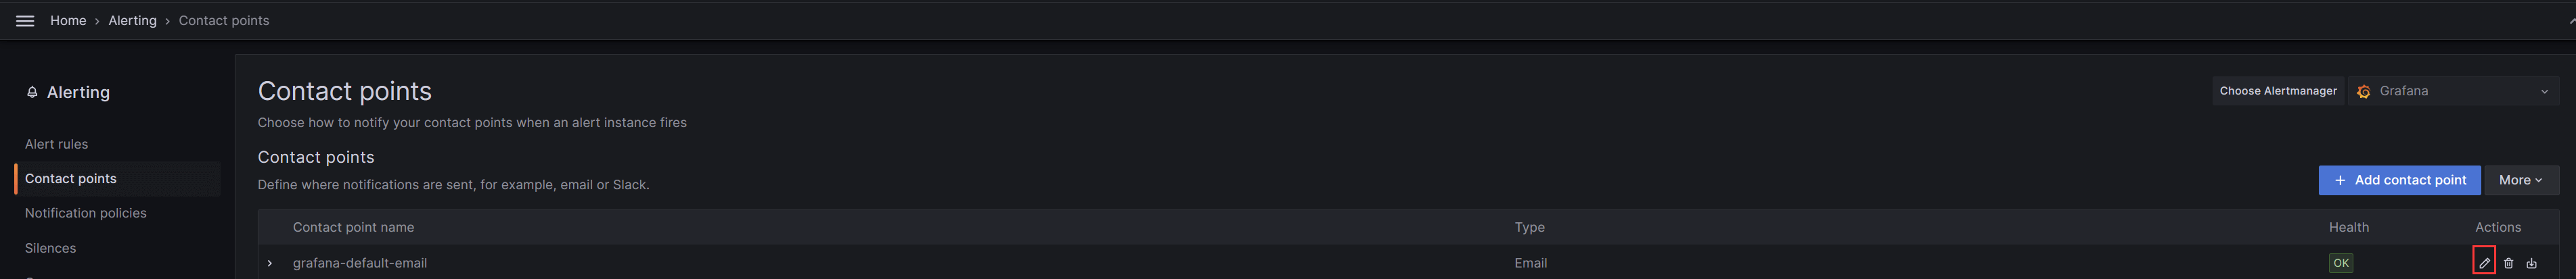
systemctl restart grafana.service2)配置Contact points
编辑默认配置:
其它选项参照如下例子:
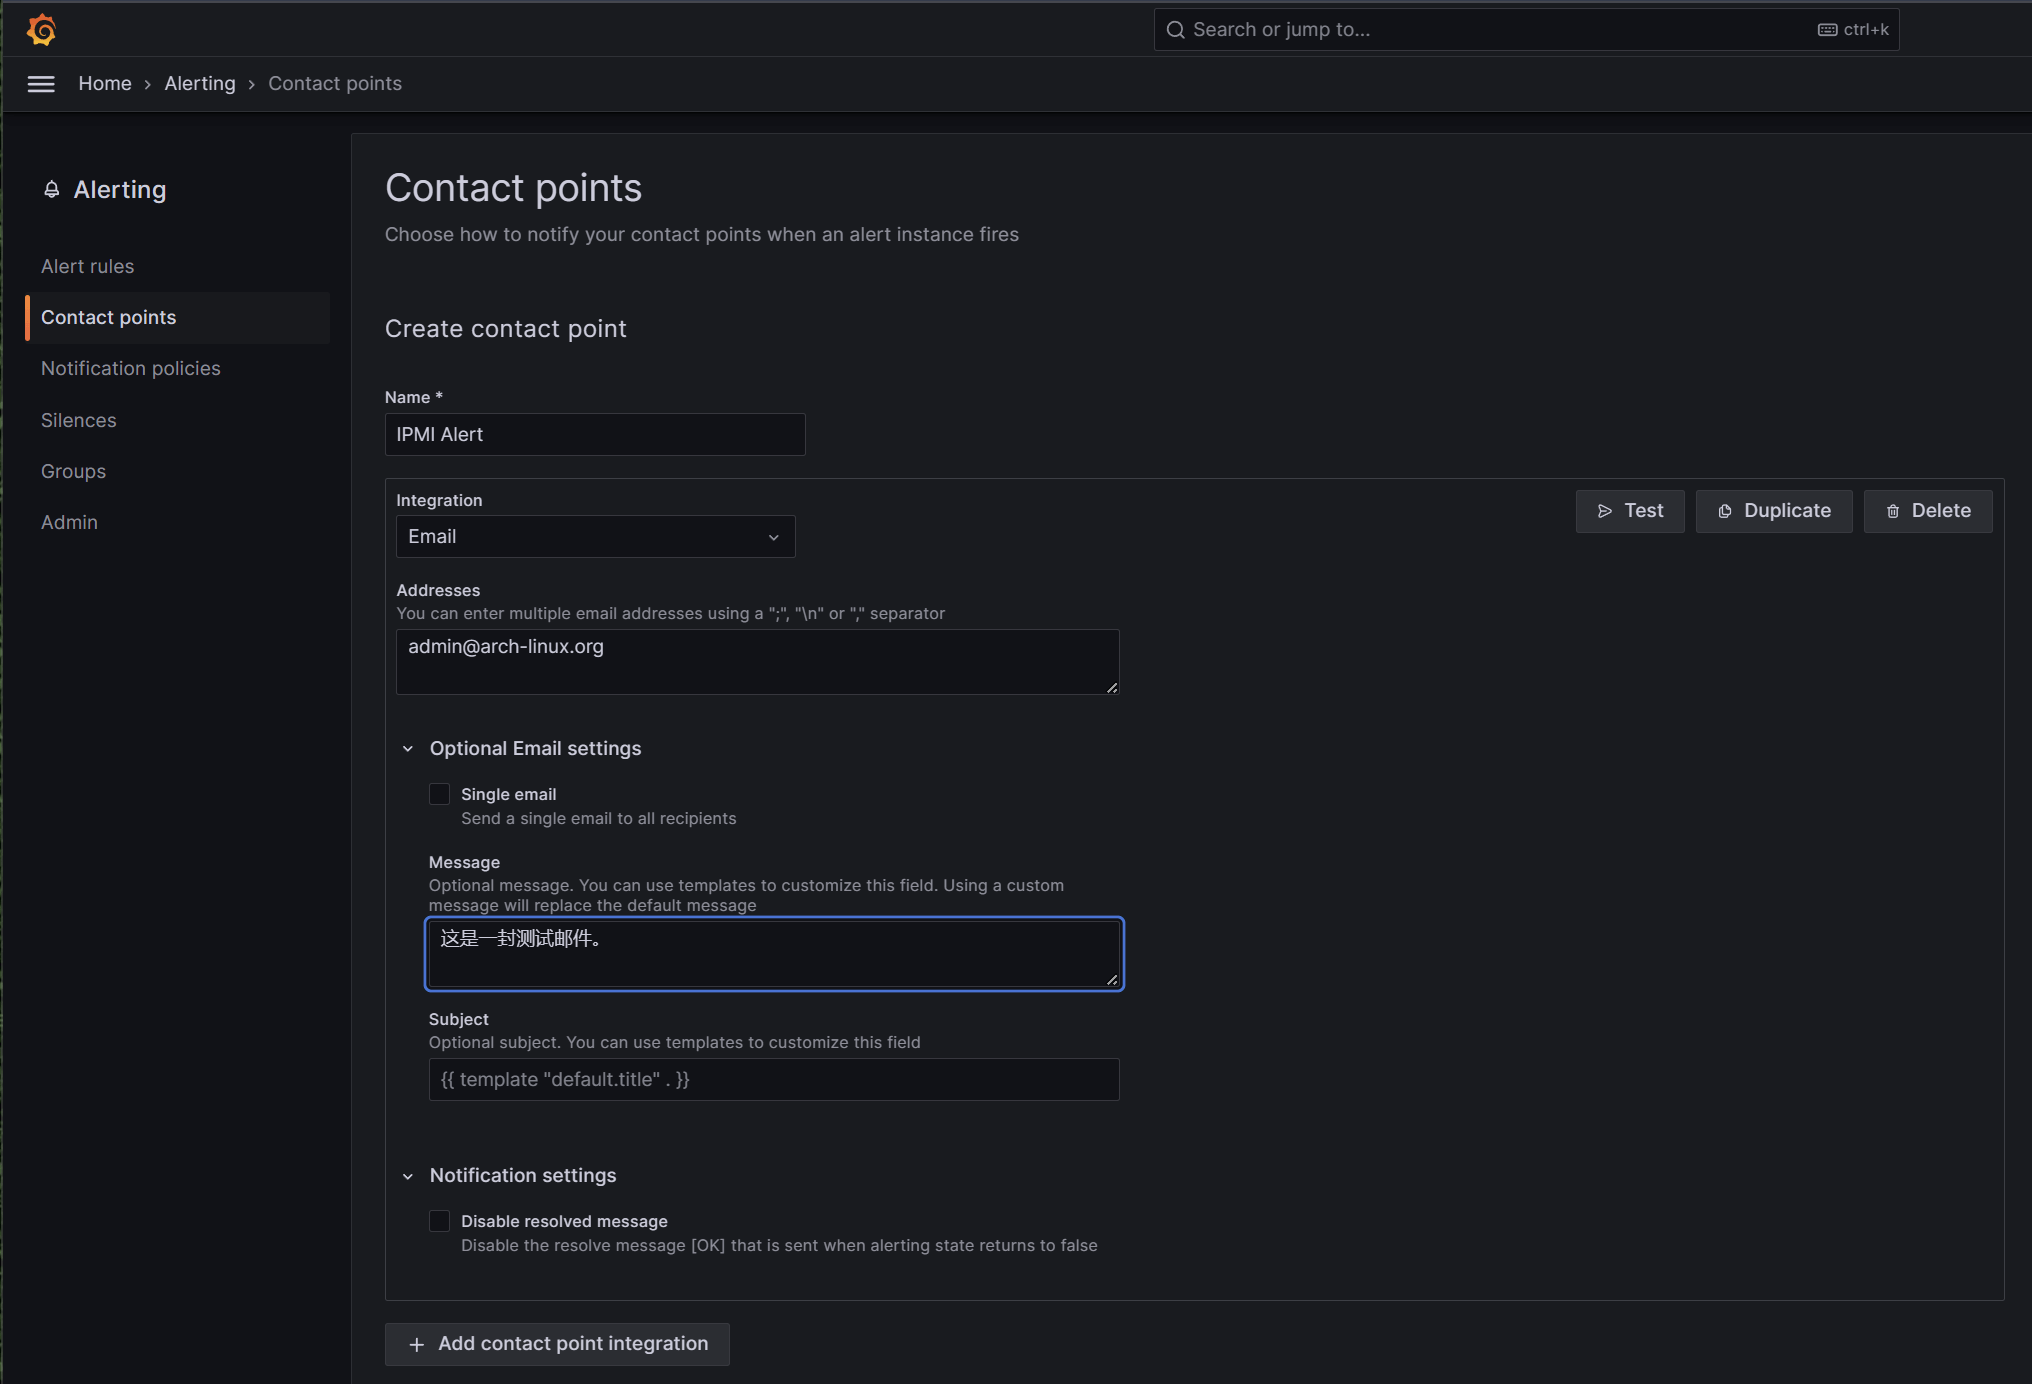
其中Addresses为要发送到的收件人地址,可以是配置的发送方自己,也可以是其它账号,可以同时配置多个账号,使用分号、换行符、逗号分割。
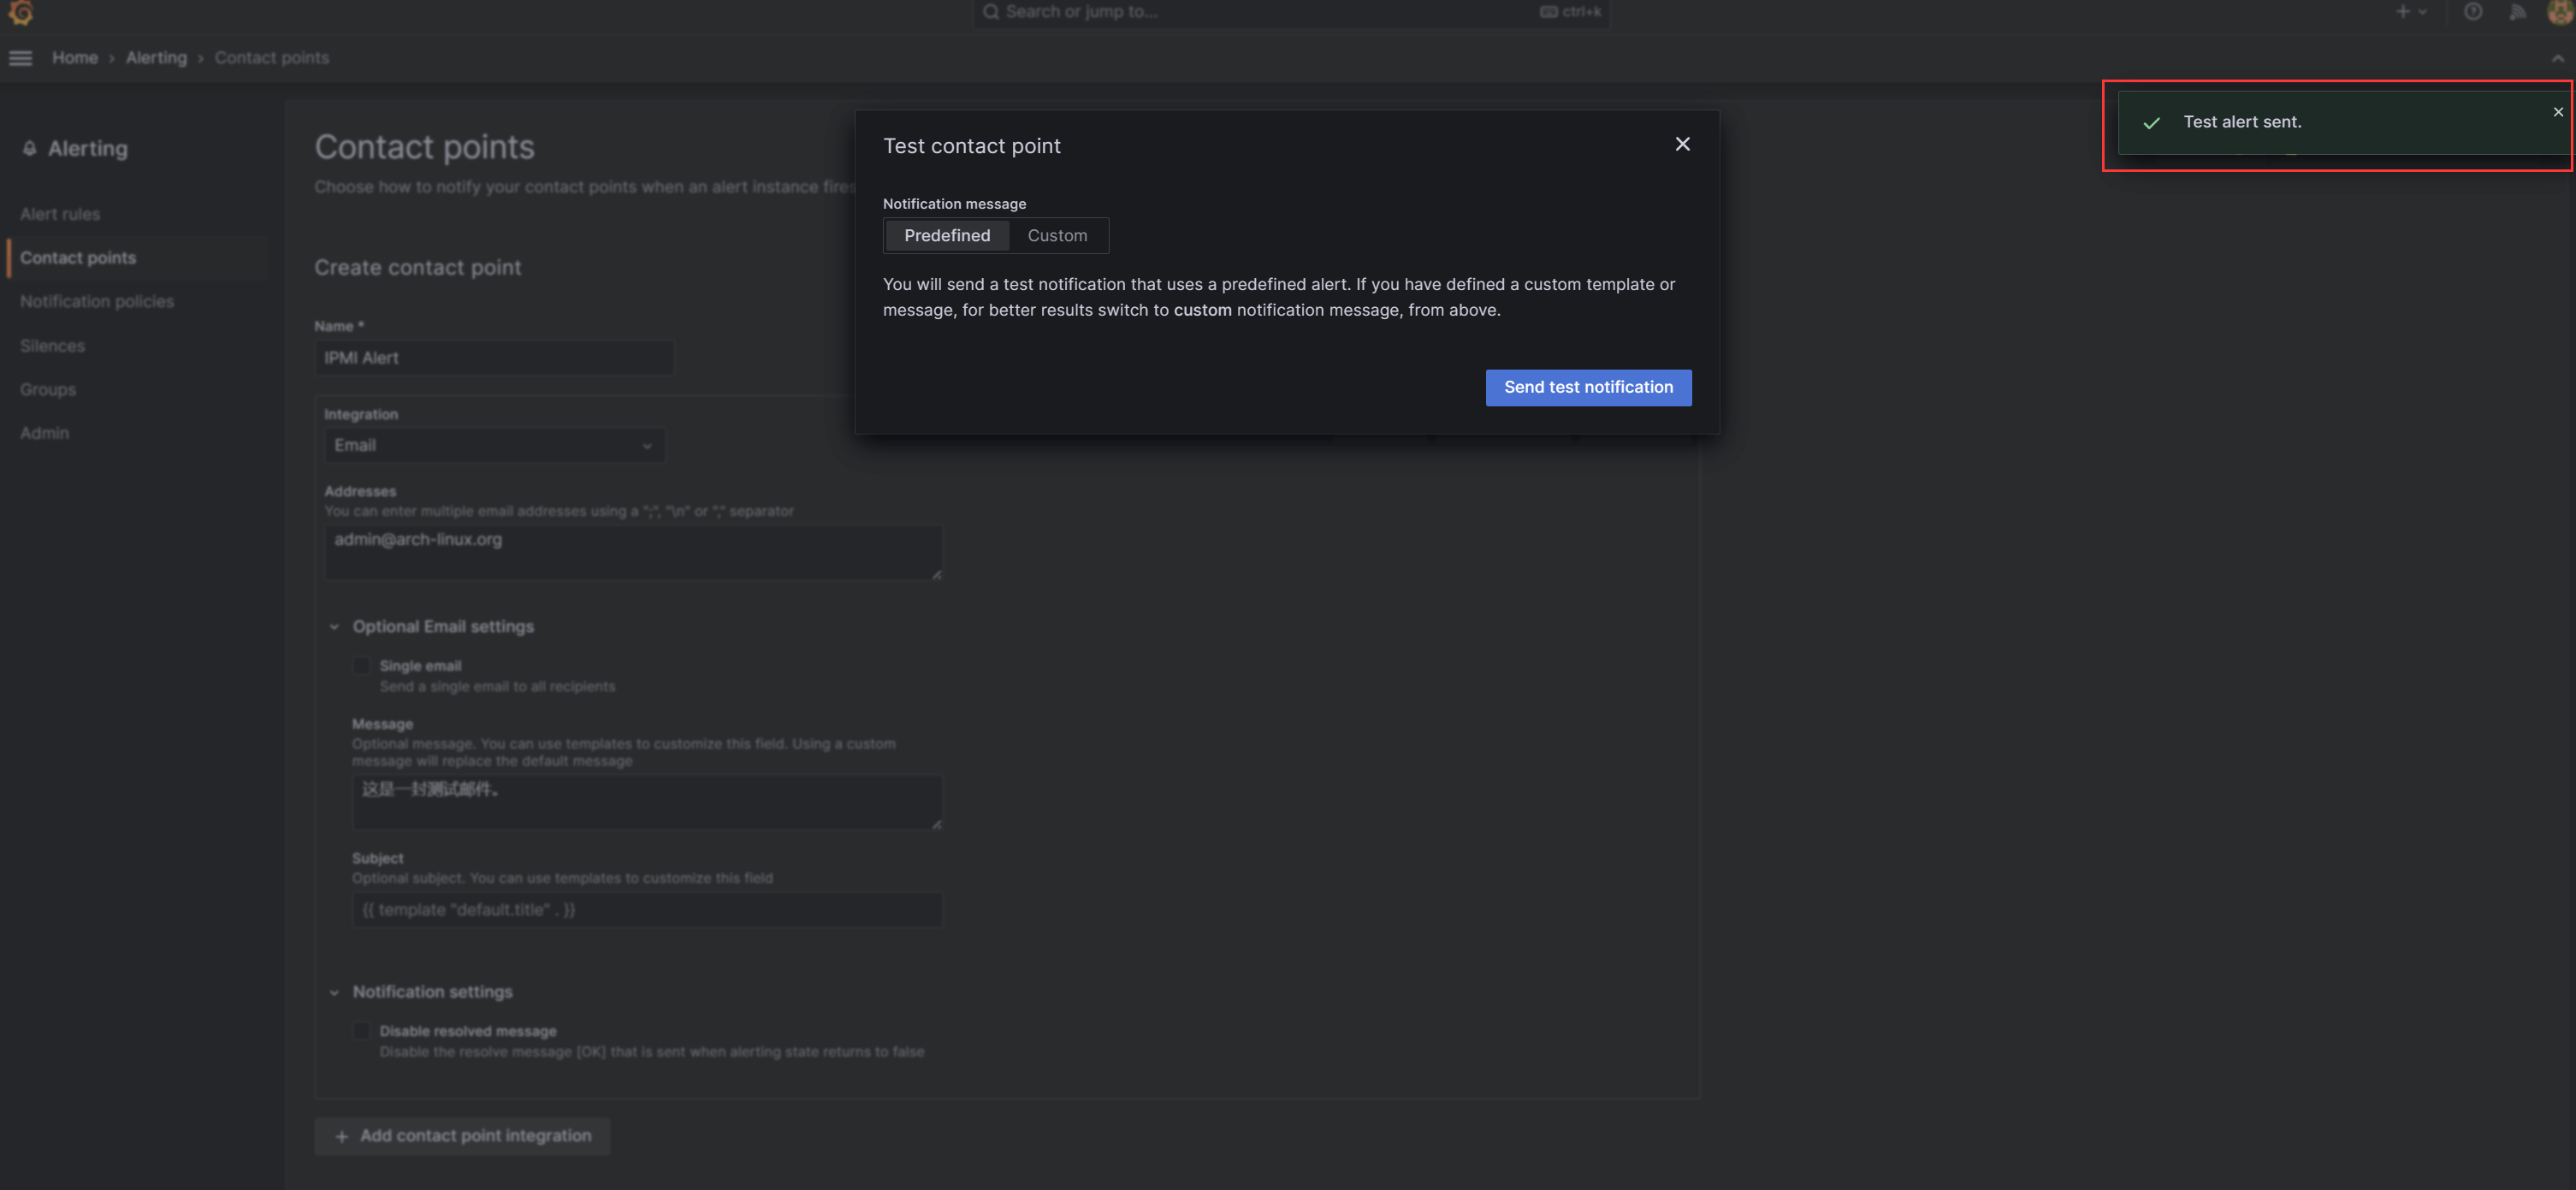
设置好后,点击Test测试,弹窗如下则说明发送成功:
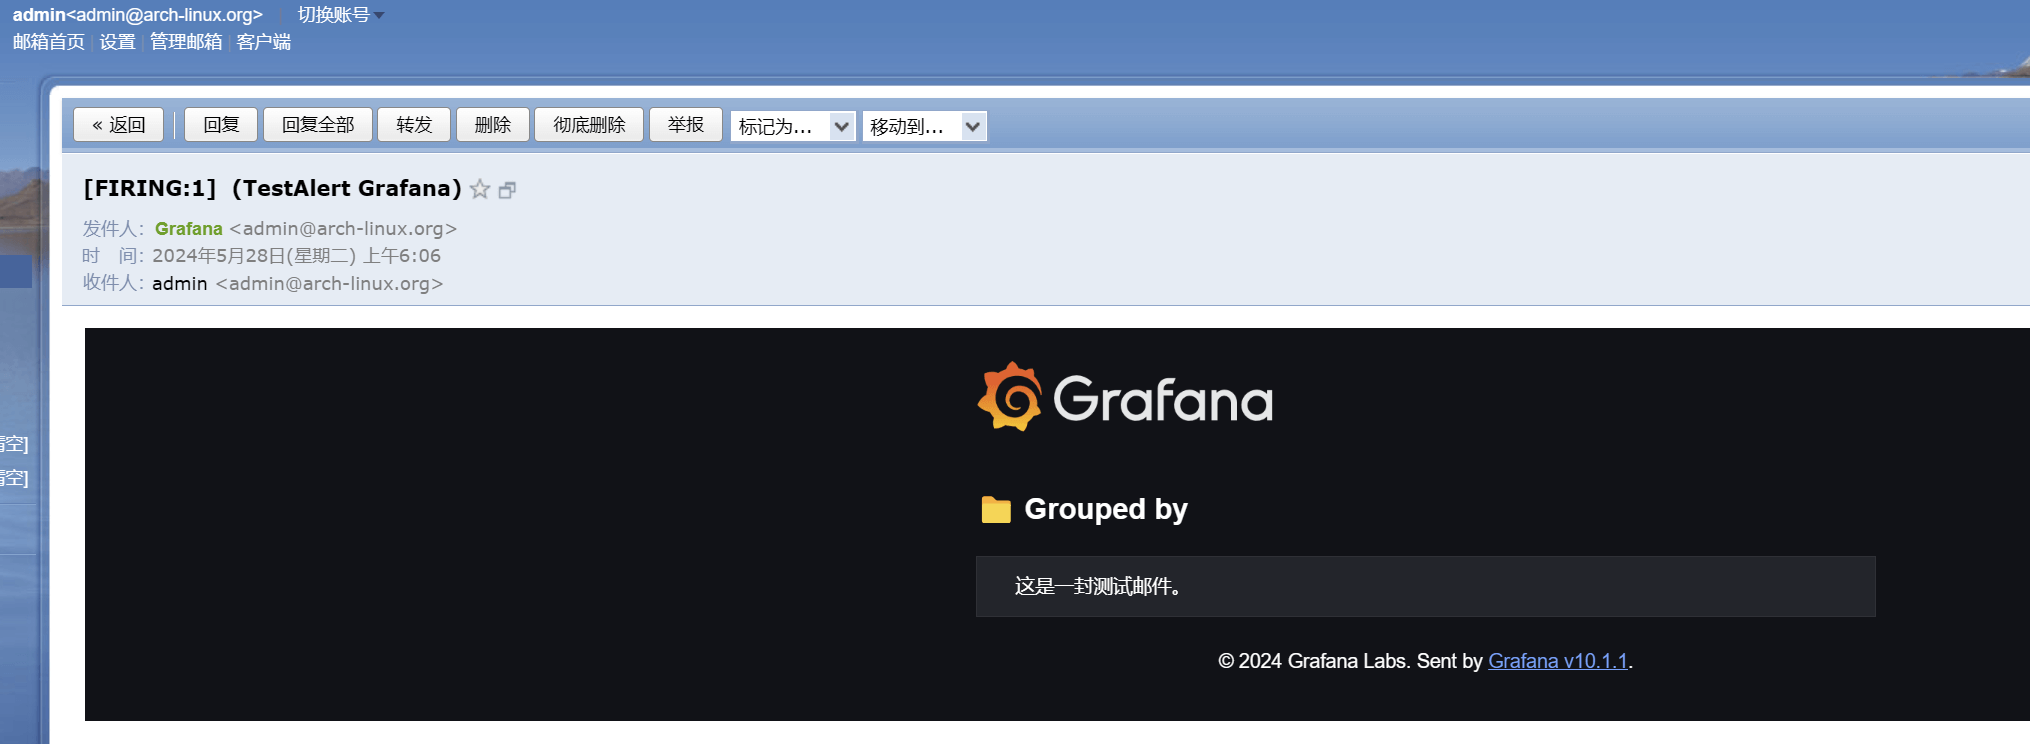
成功接收到测试邮件:
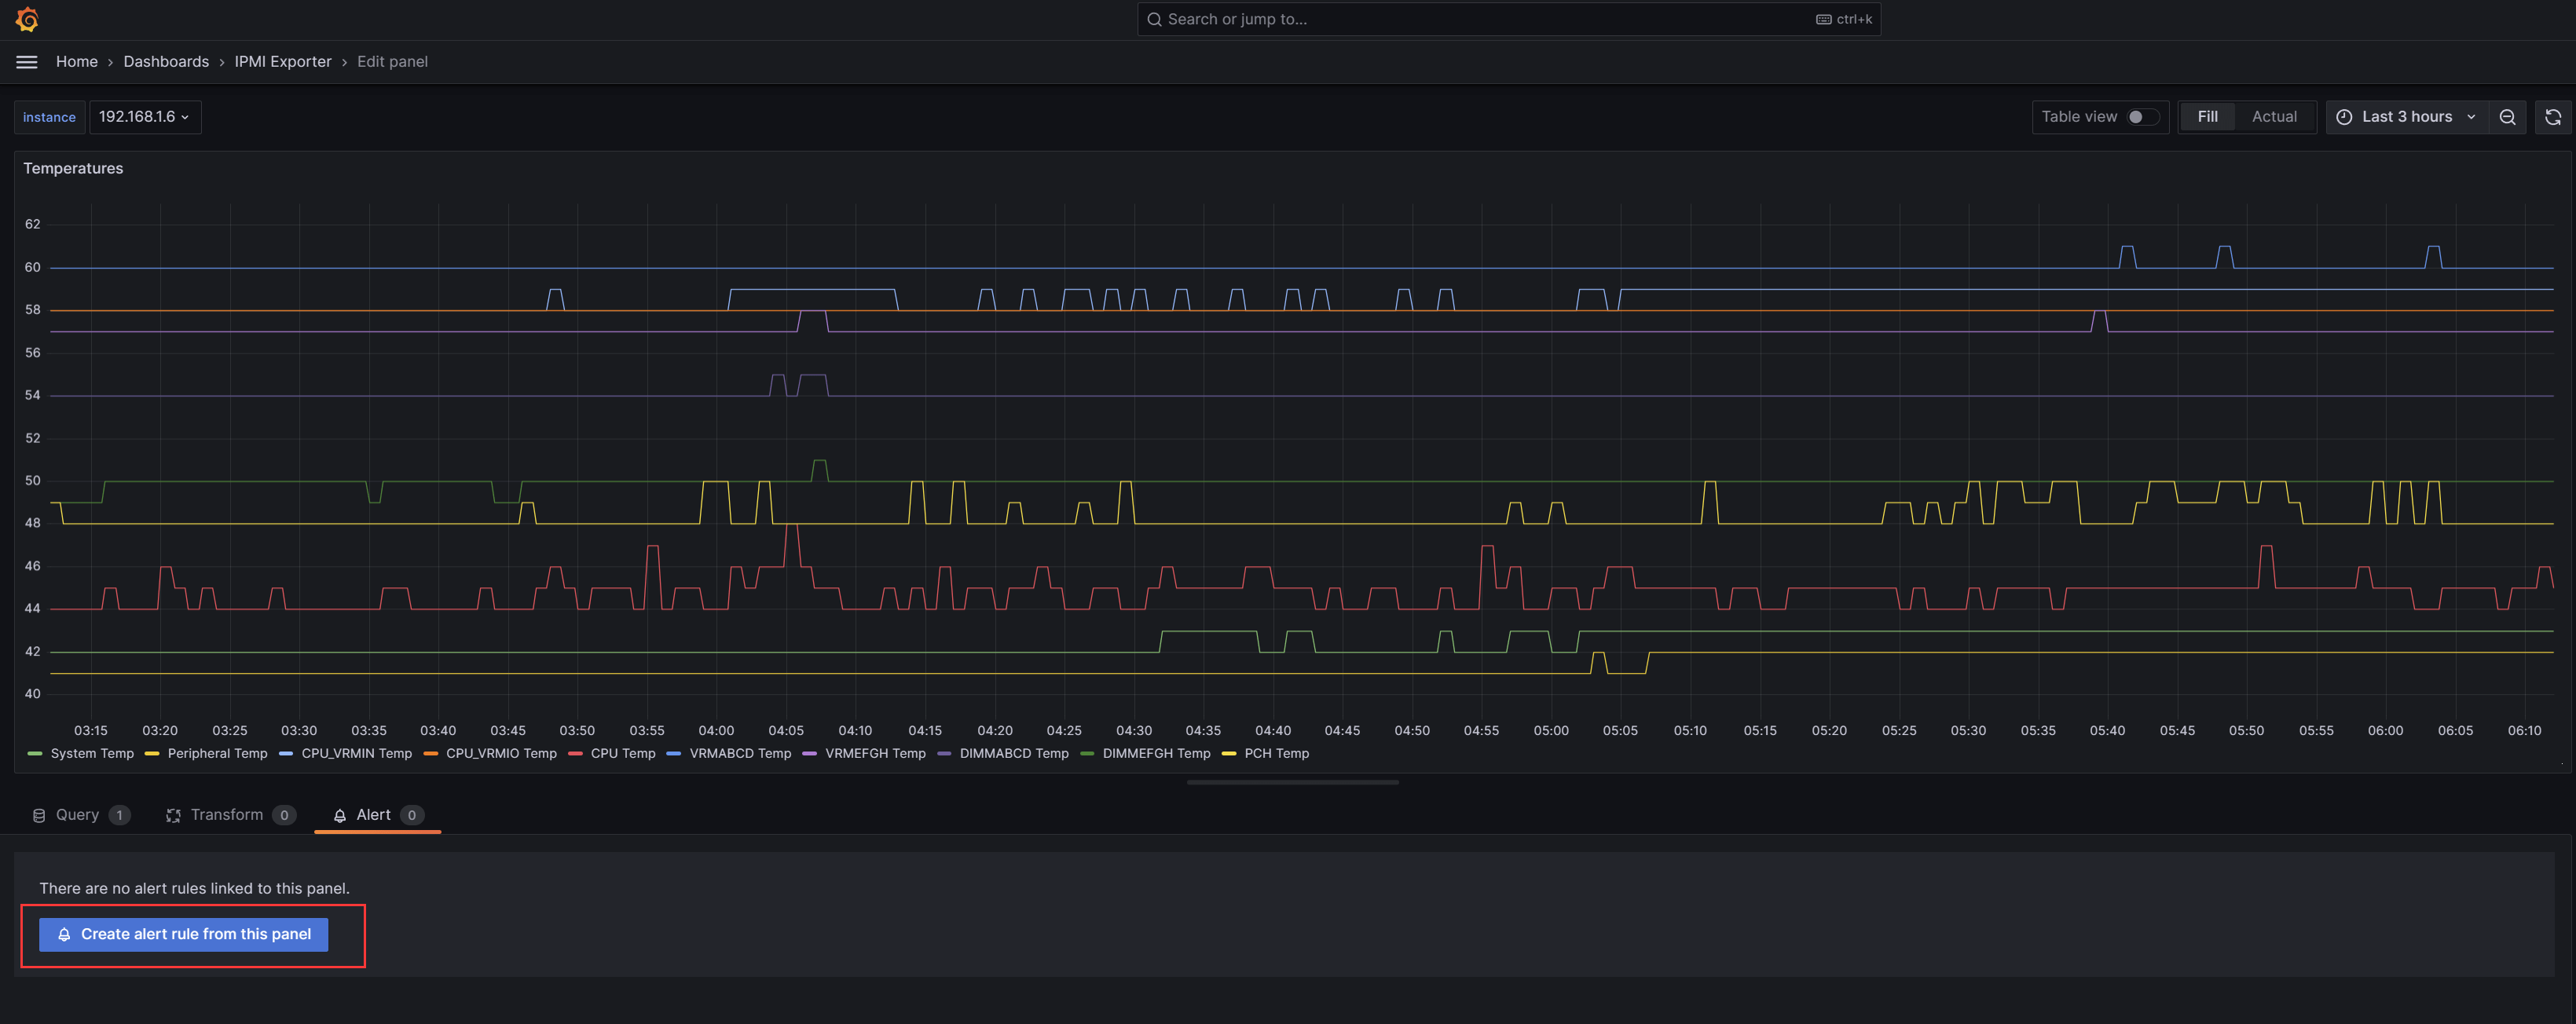
3)配置IPMI监控告警
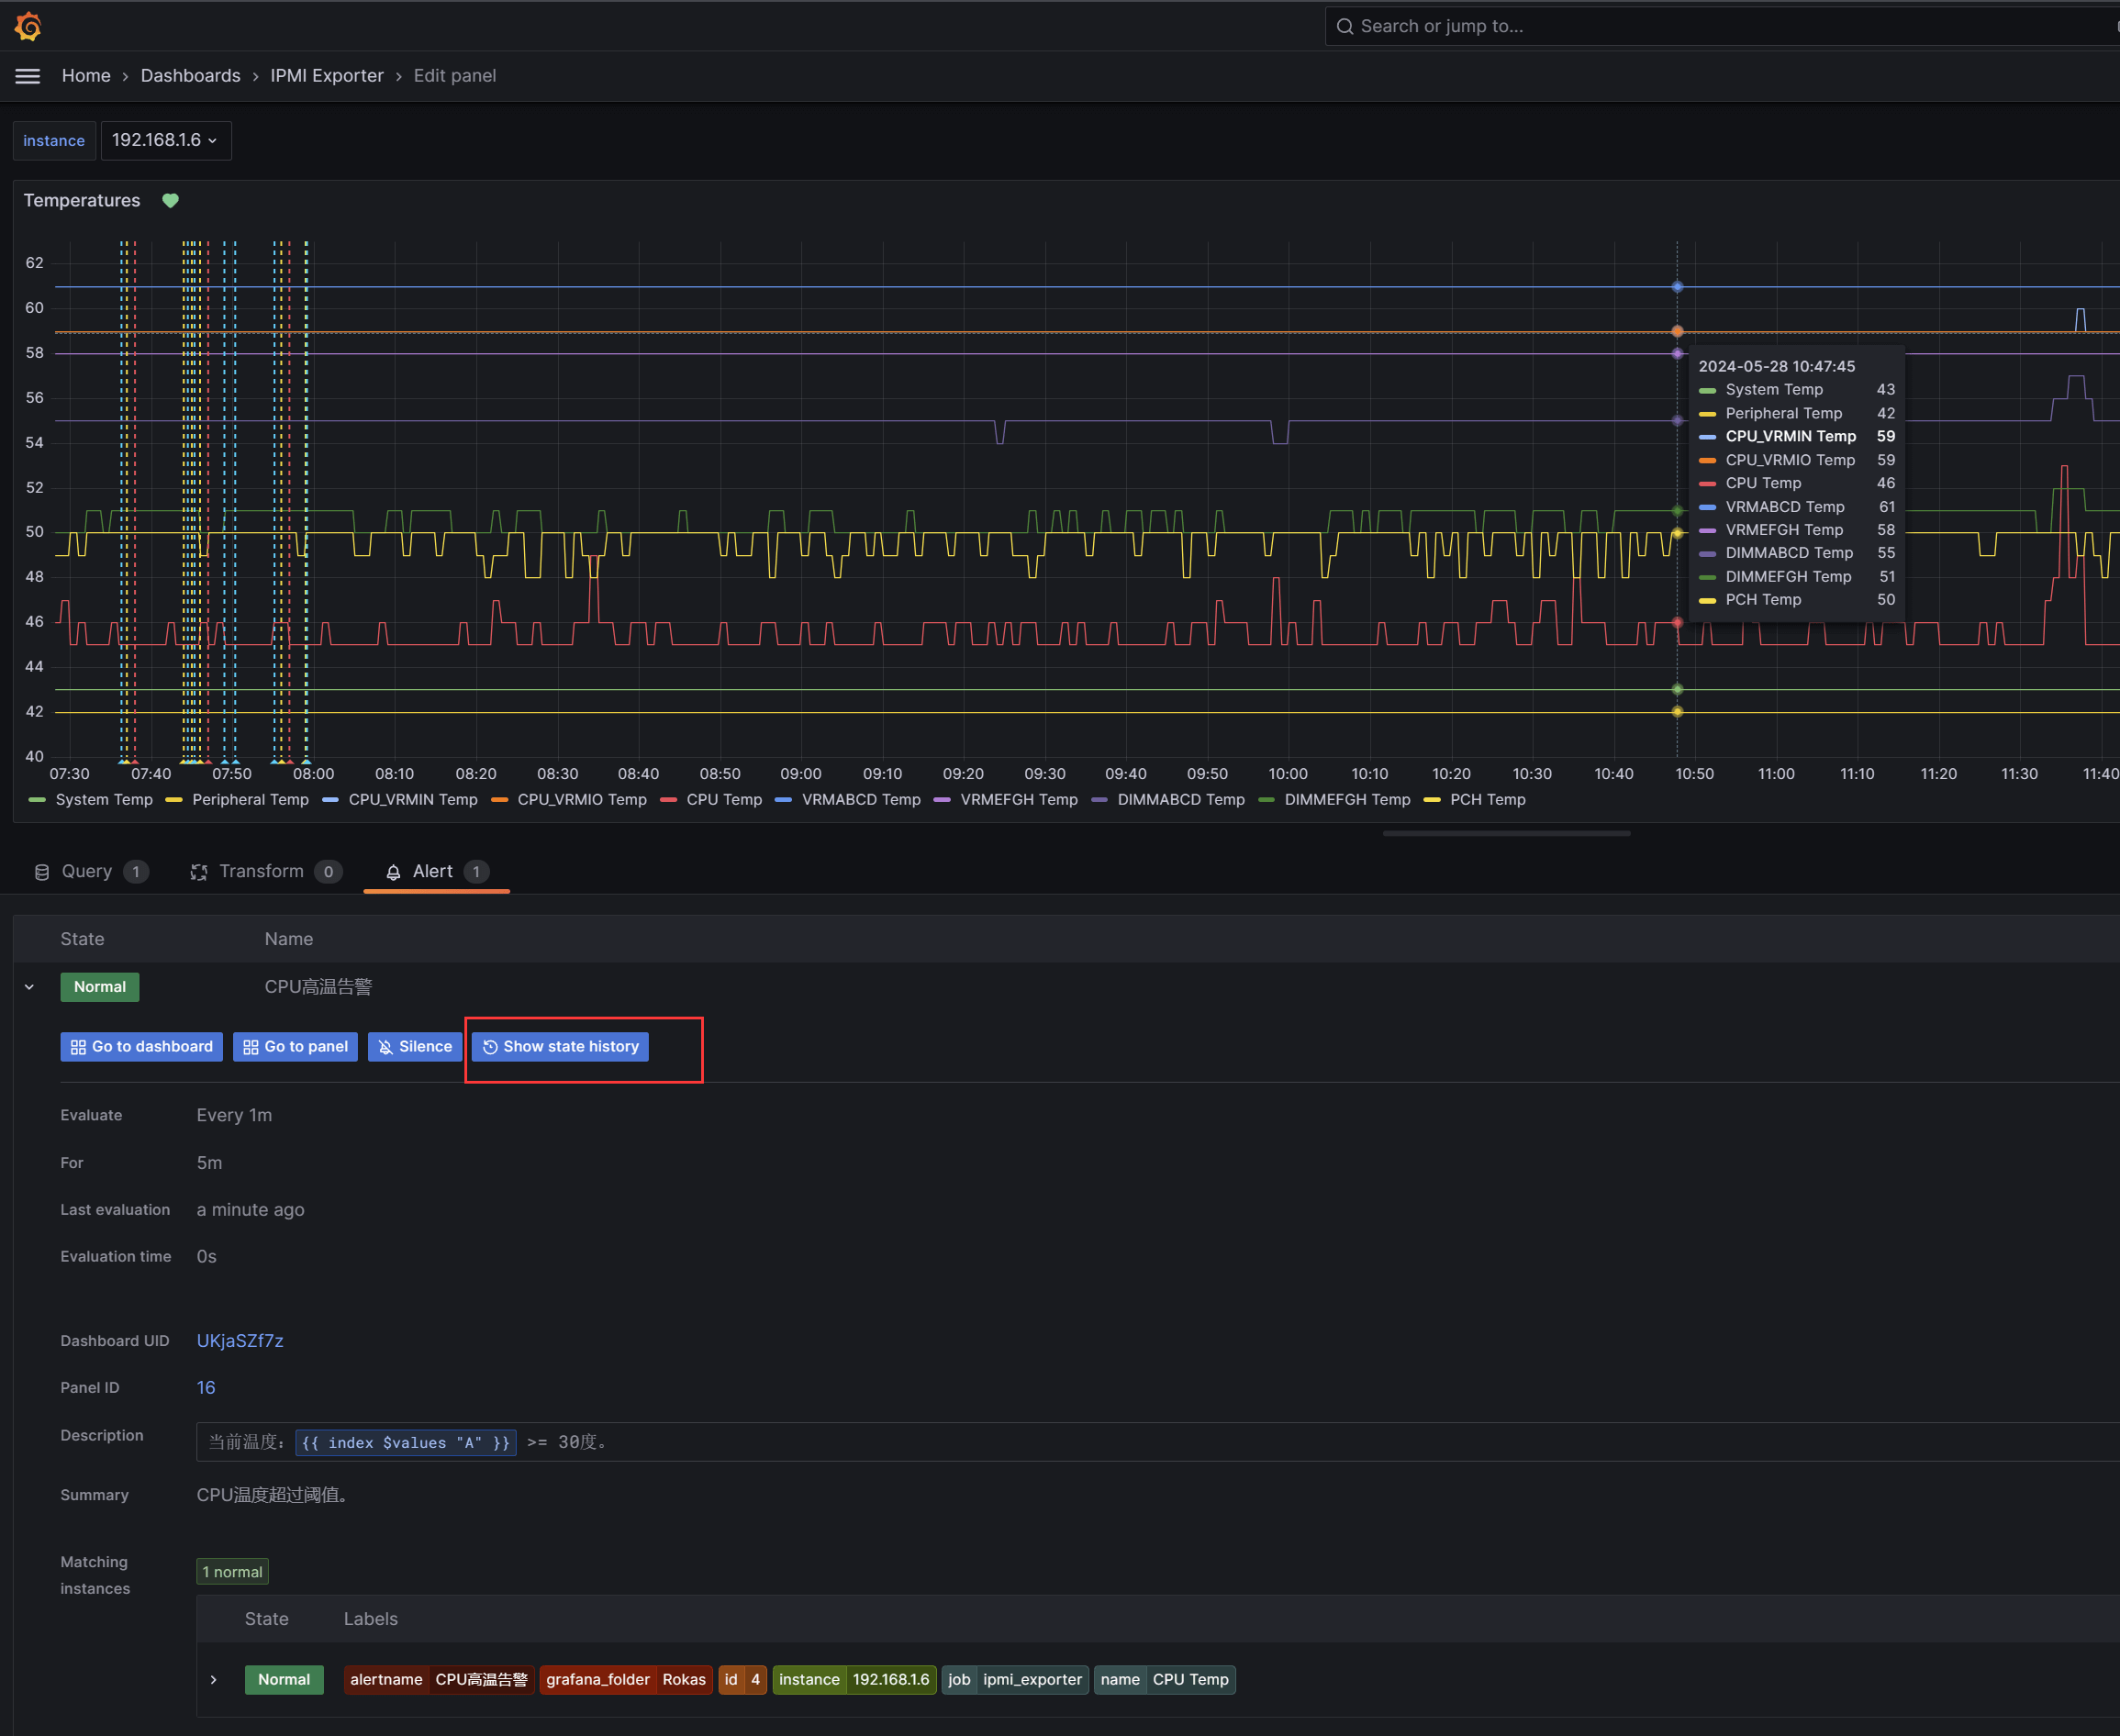
回到IPMI监控面板,这里以设置CPU温度告警为例,进入到温度监控视图编辑页面,增加此面板的告警:
编辑规则,含义如下:
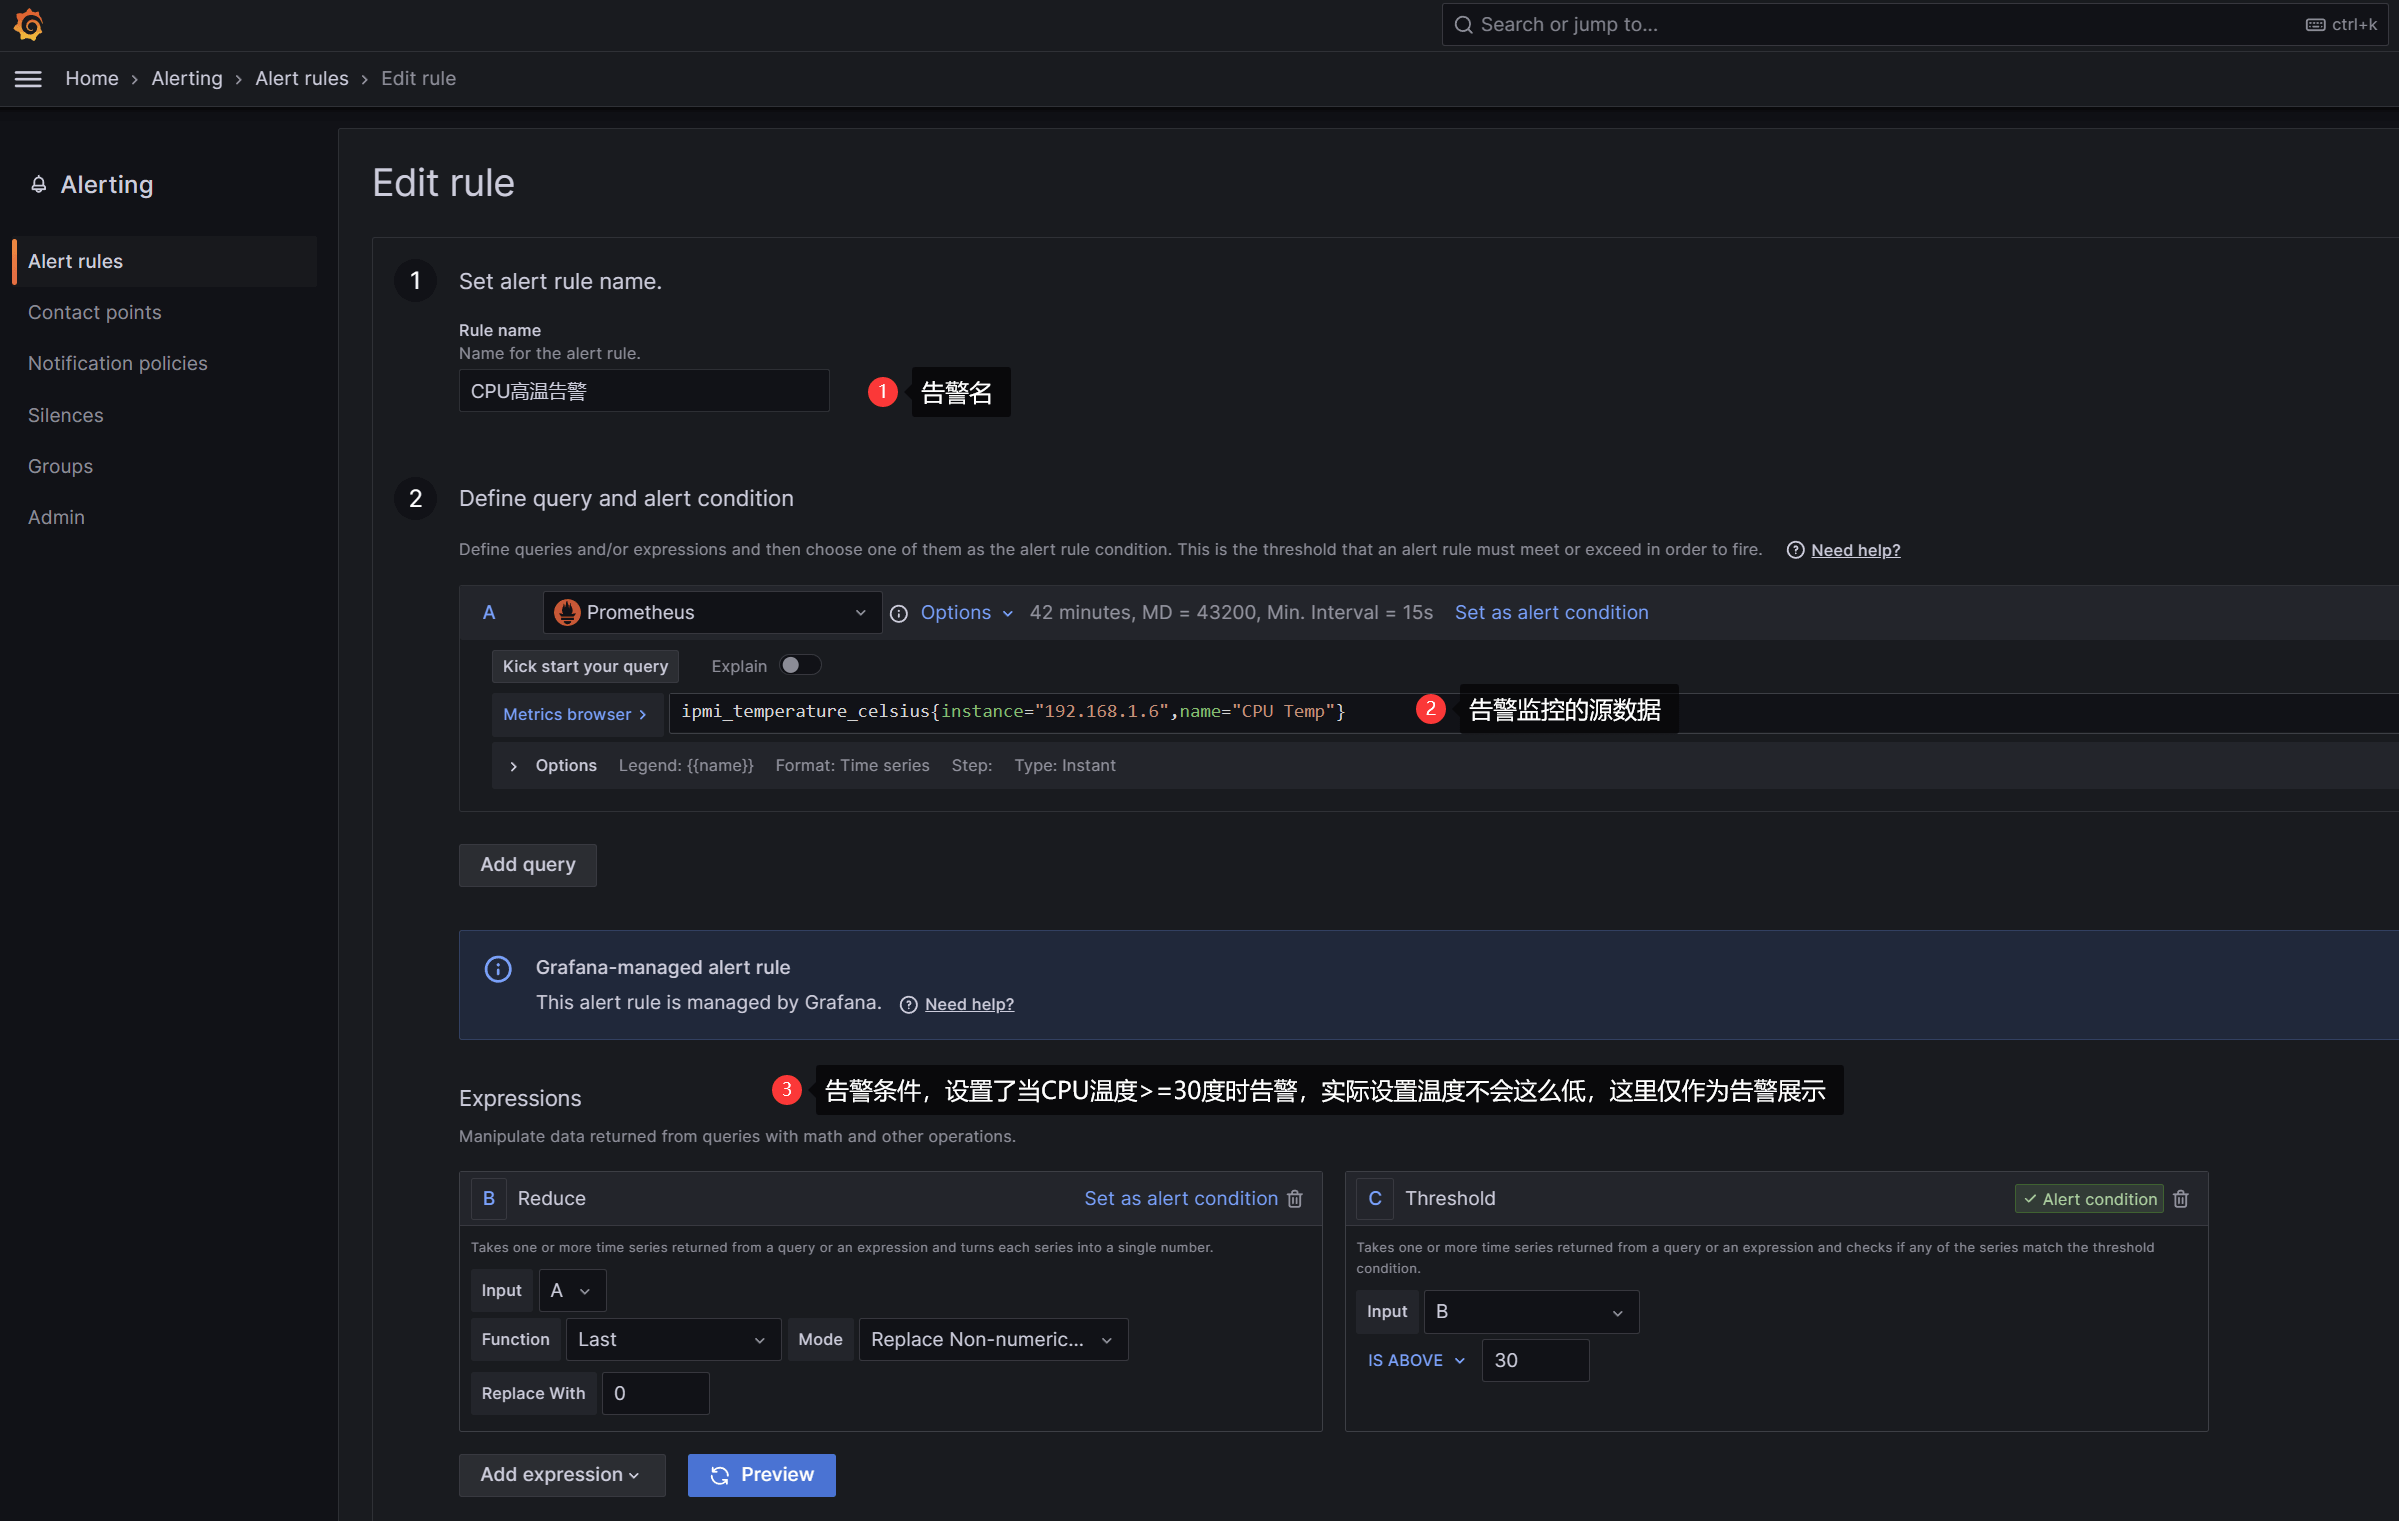

最后点击右上角的保存并退出即可。
之后回到IPMI Exporter温度模块视图,等待一两分钟后,可以看到左上角小红心有正常绿色变为黄色,状态为Pending:
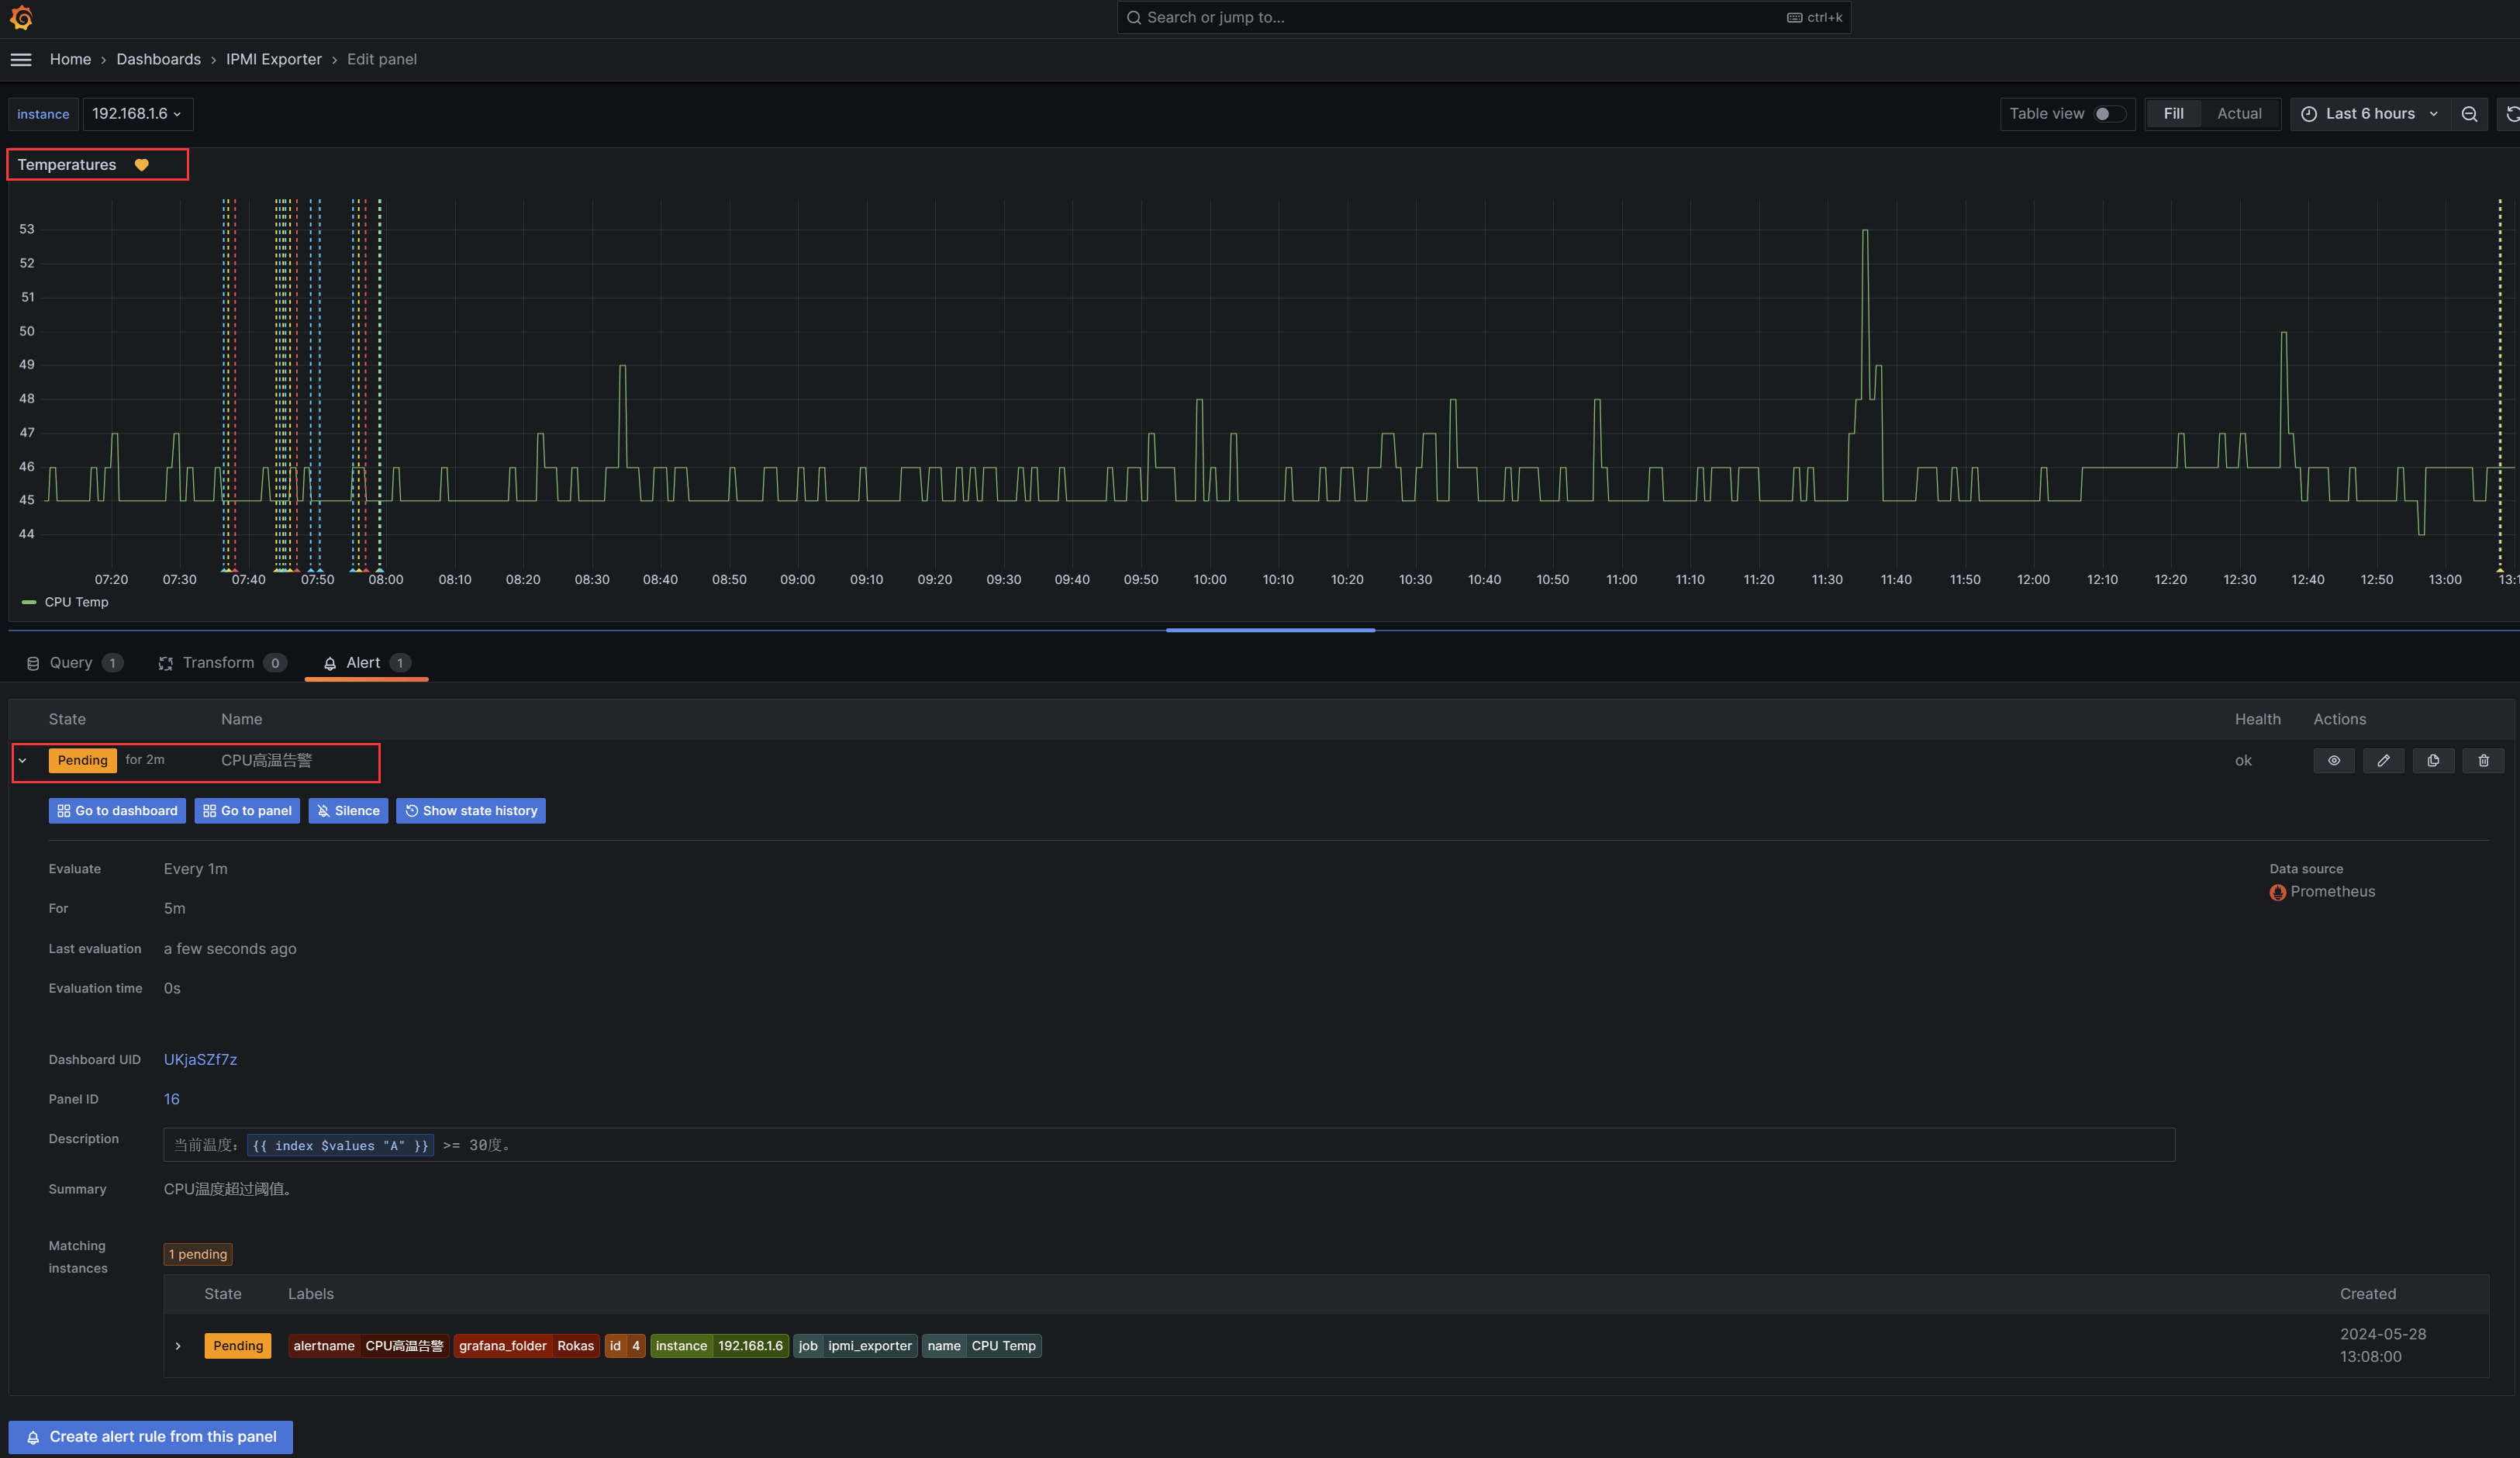
Prometheus的警报有如下几种状态:
- inactive :警报未被触发。
- Pending:警报已被触发,但还未满足for参数定义的持续时间。
- Firing:警报被触发警,并满足For定义的持续时间。
当Pending持续五分钟后,则会进入Firing状态,触发告警。
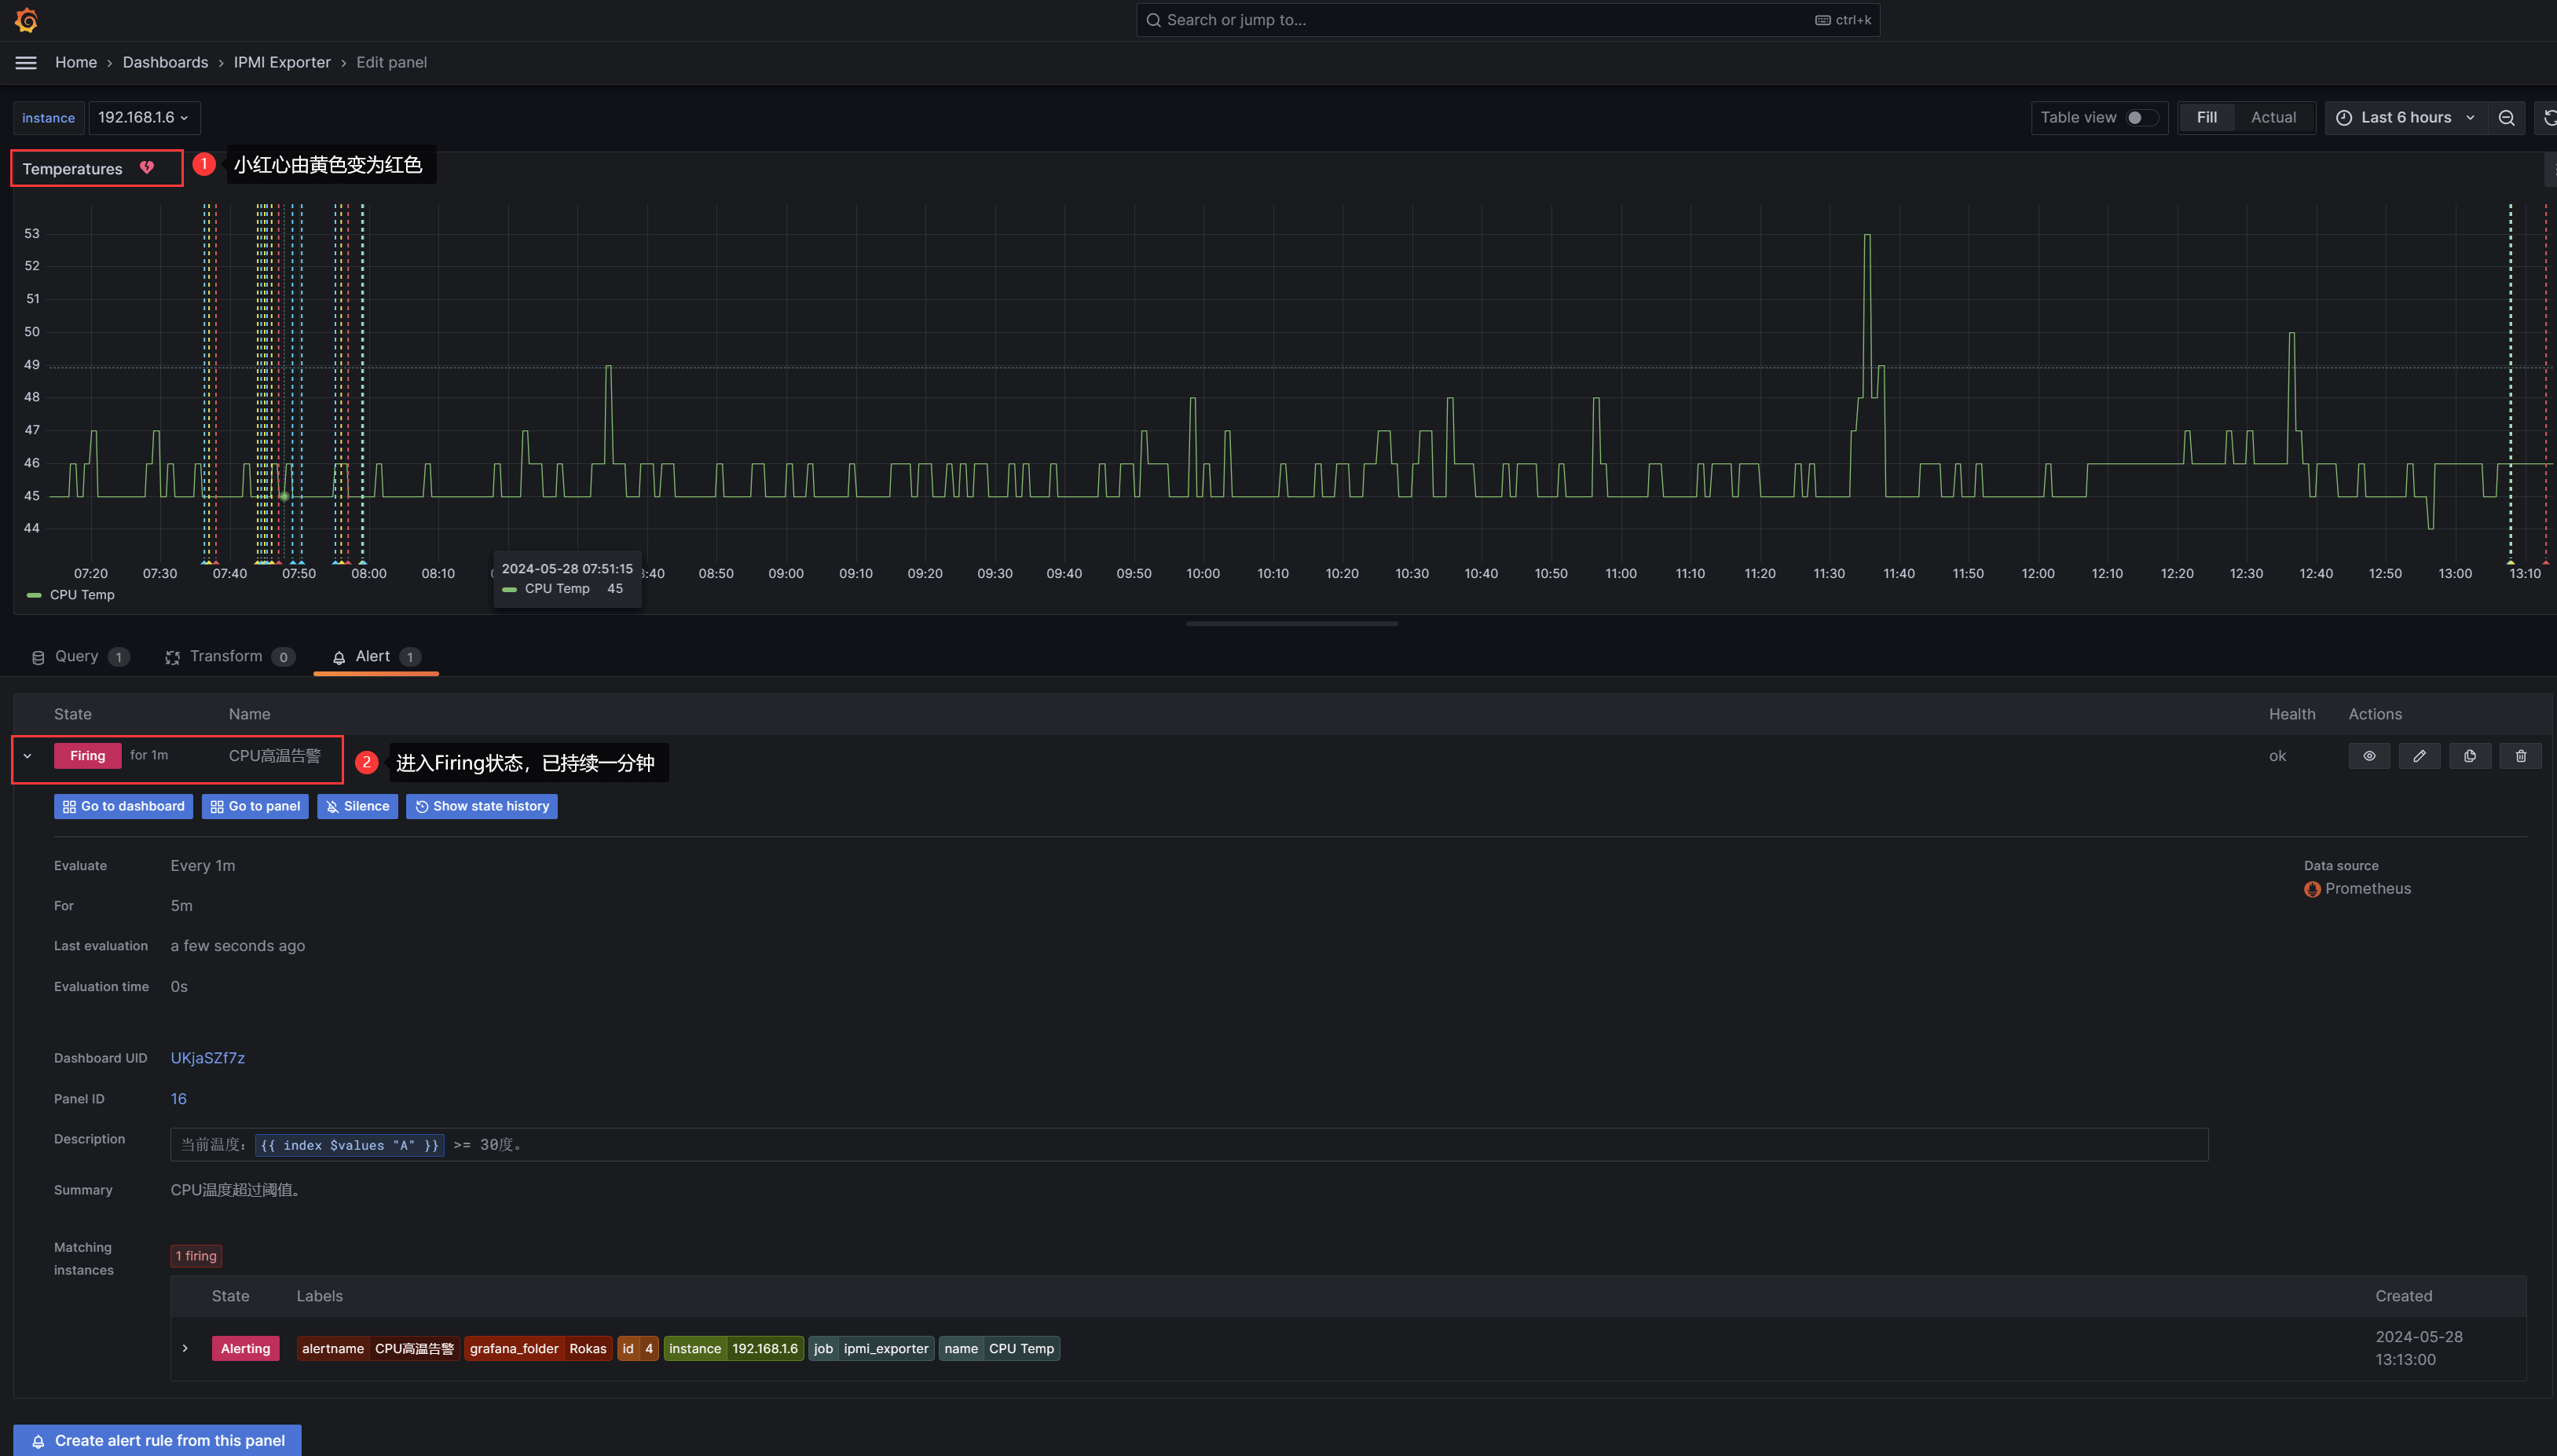
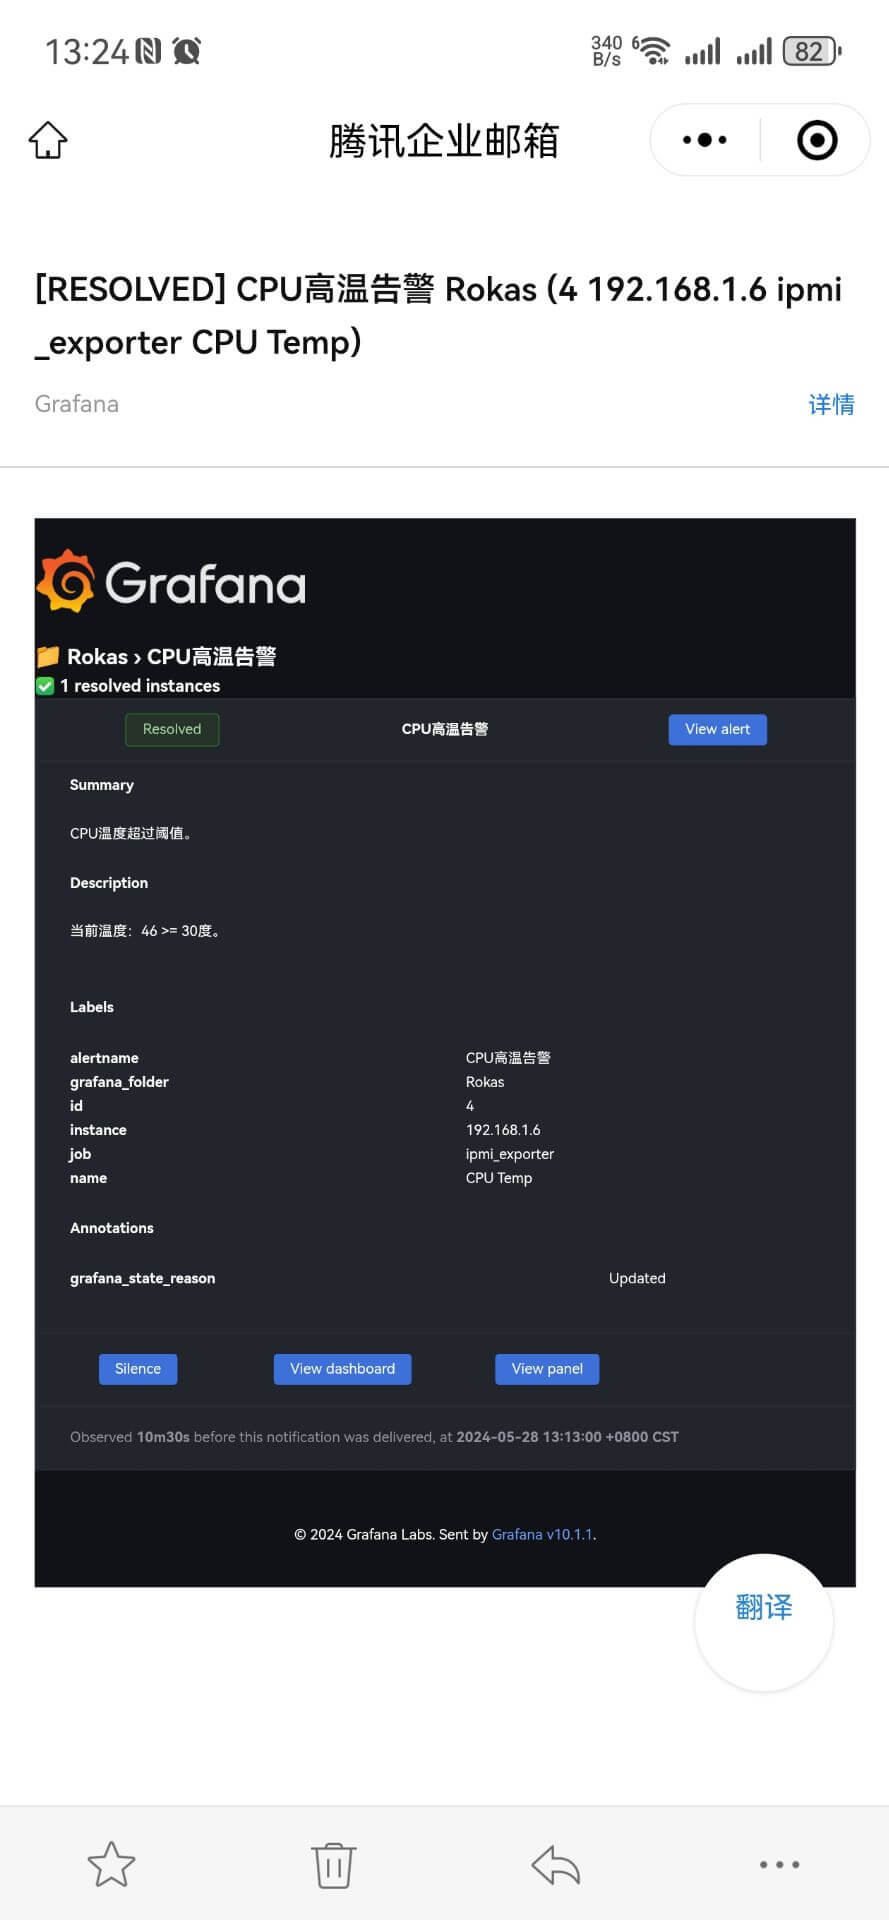
进入Firing状态后,此时已收到告警邮件:
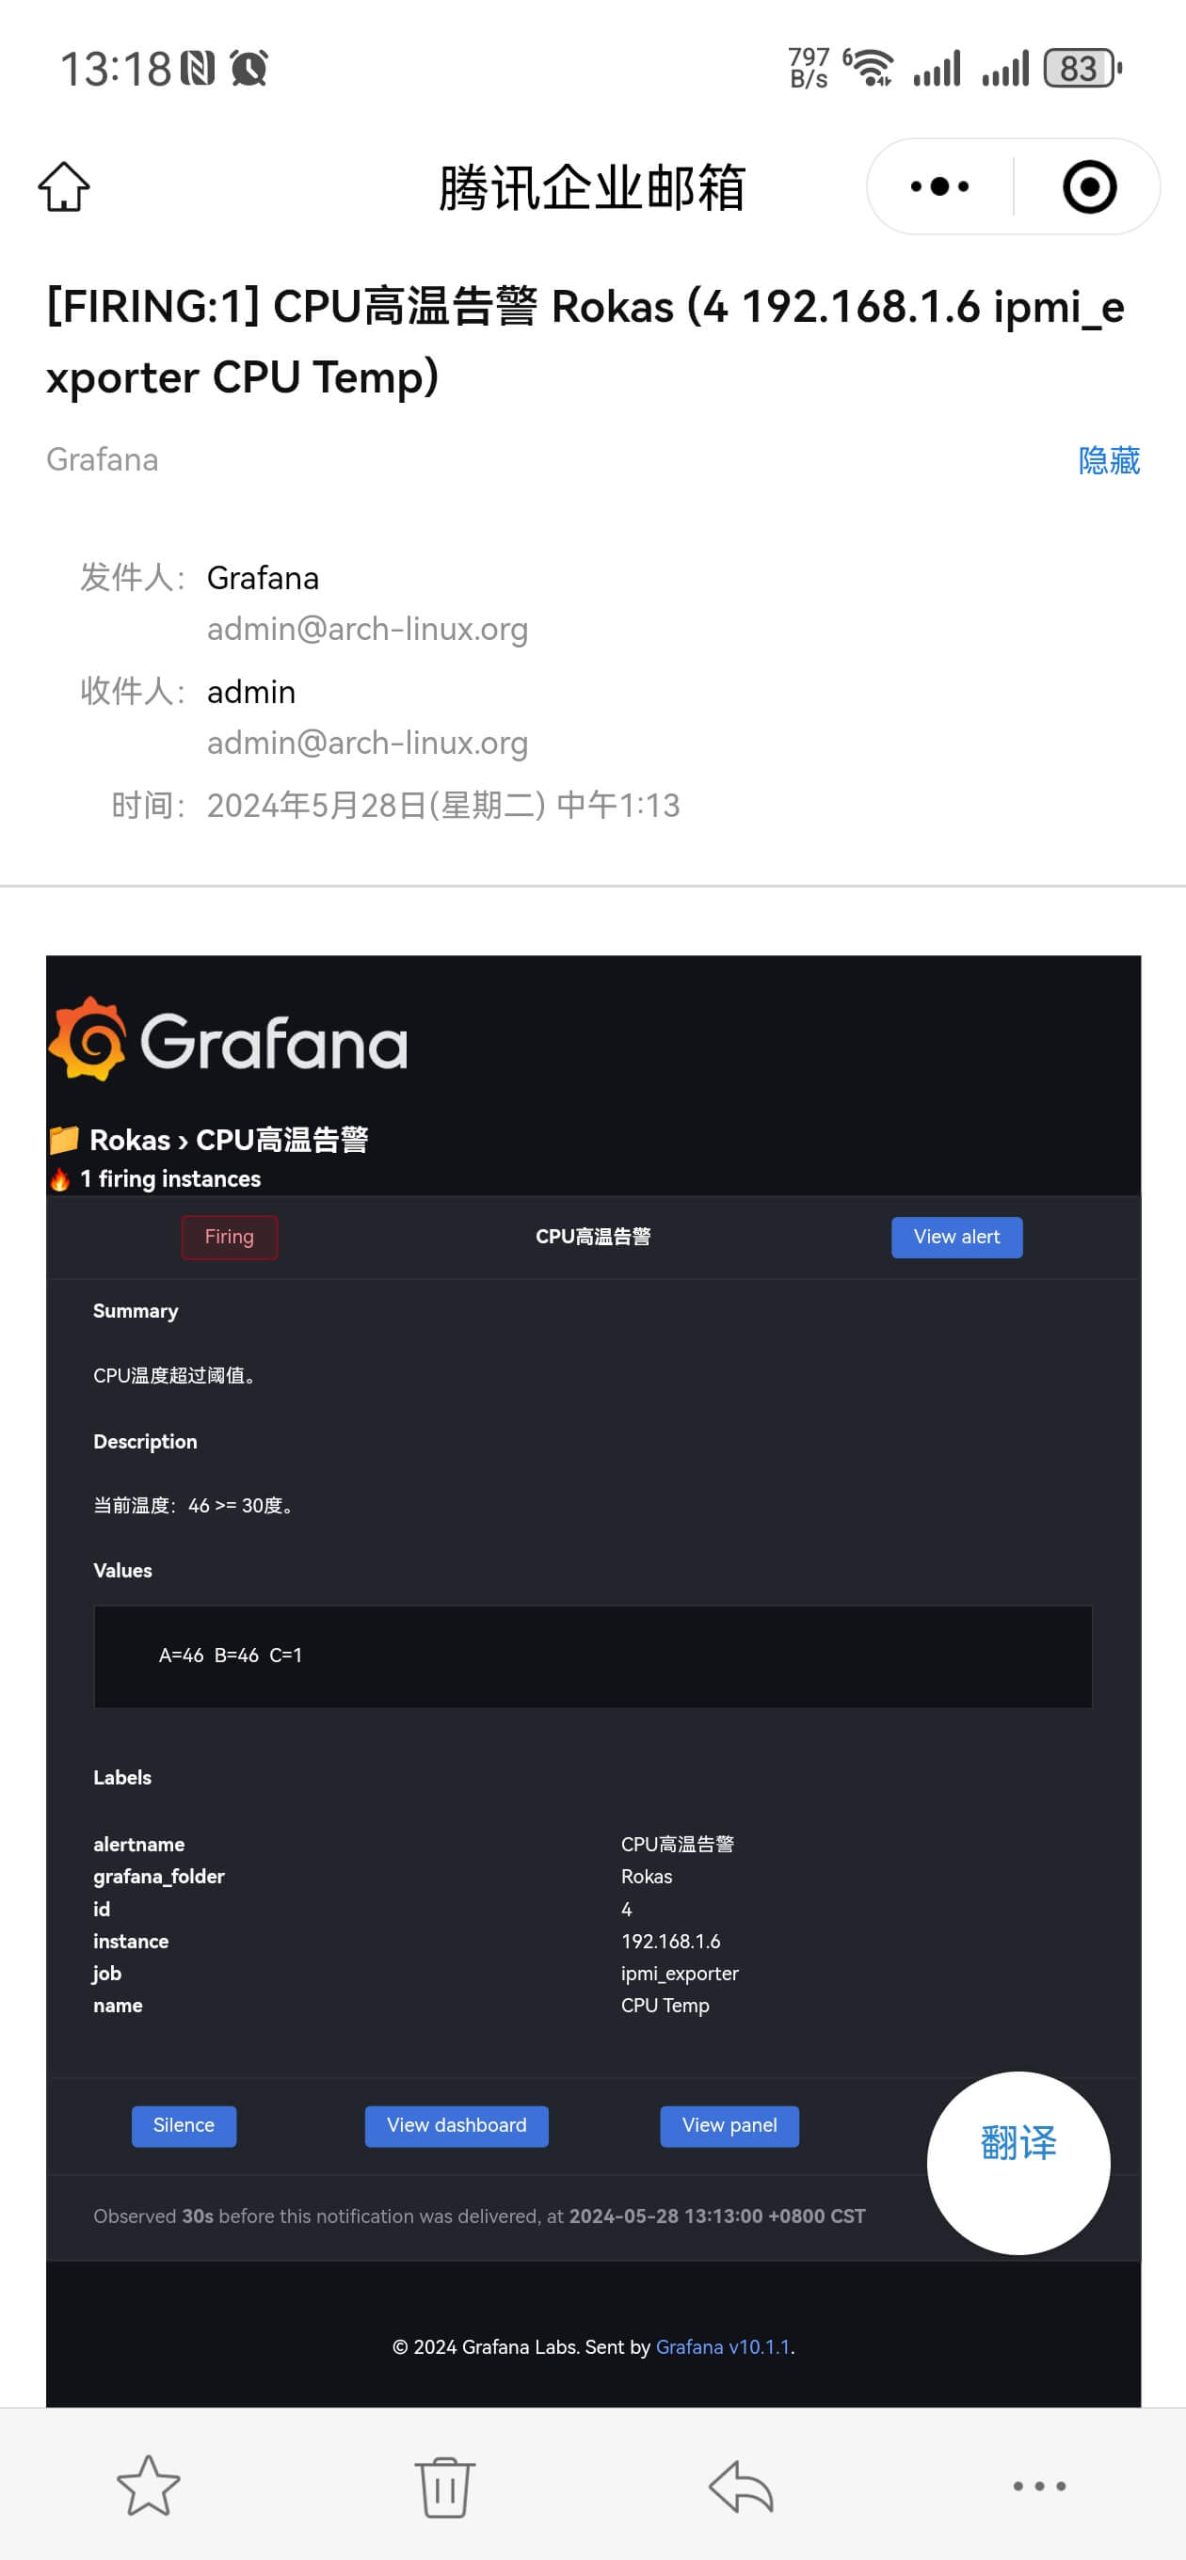
同时会输出A、B、C三个取值,其中C的判断表达式只有1和0,对应True和False。
此时我们把C的表达式阈值修改大一点,比如80摄氏度,当实际温度小于80°时,则会收到一封告警恢复邮件:
回到温度监控视图,可以查看历史状态变化:
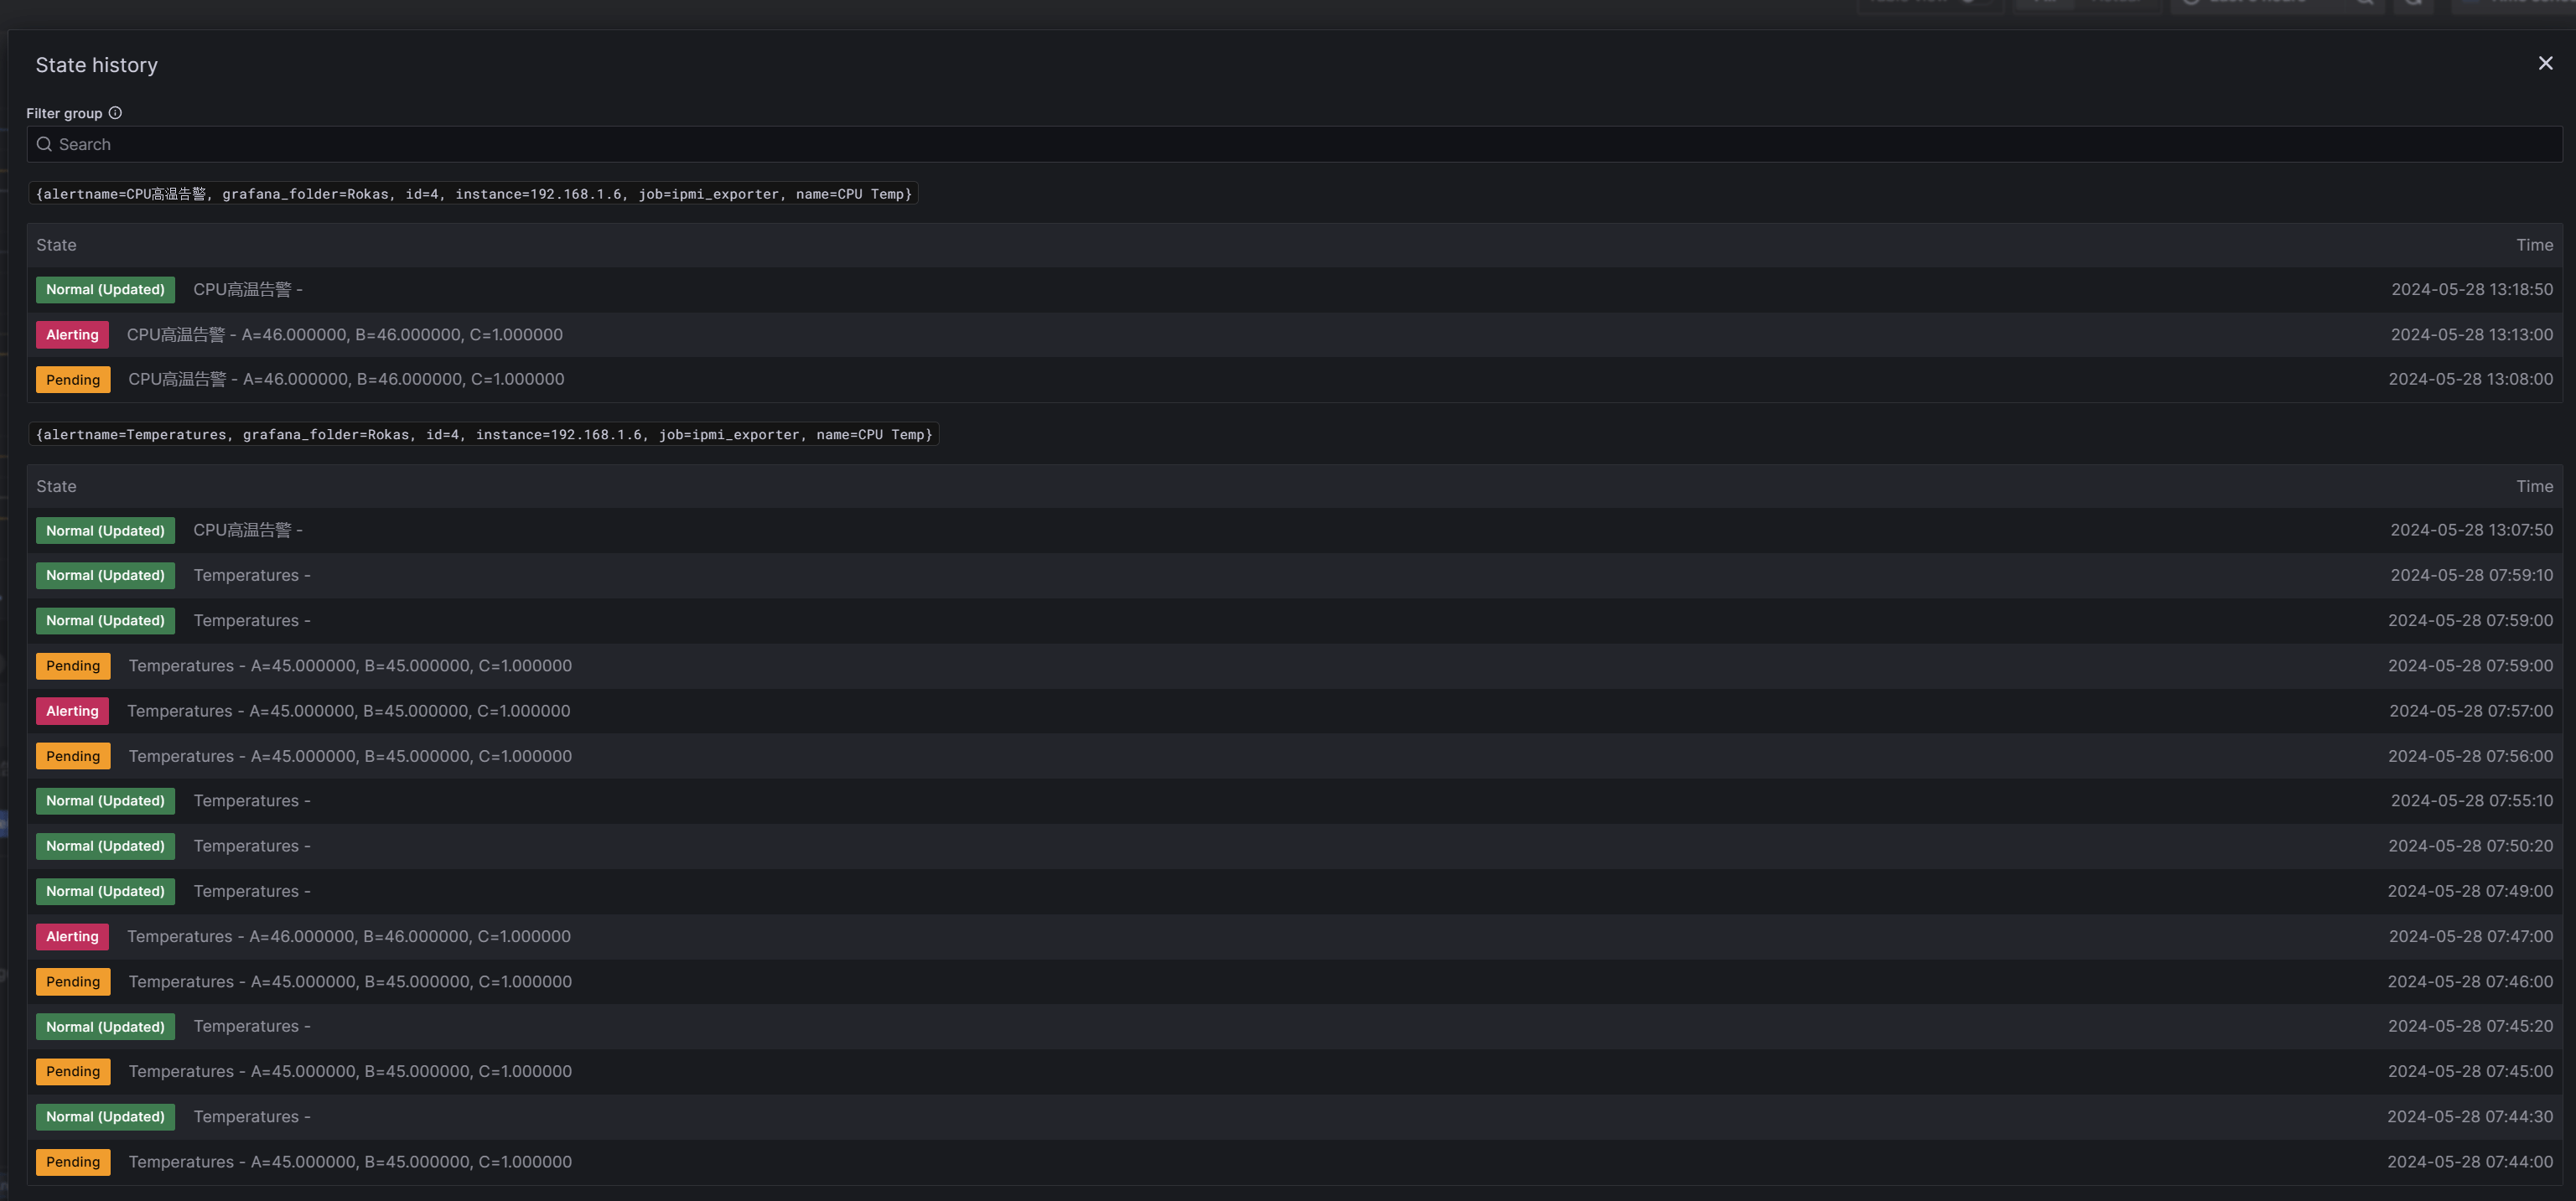
此例子仅展示了CPU温度指标的告警,其它指标告警设置同理,根据不同需求场景,告警条件可以更充裕更复杂。